Curated OER
Data Collection and Record Keeping. Measuring Larval Growth and Development
Students keep data records of the growth of Monarch larvae. The observations are made with the change of each stage of development. The observations are to stimulate the answering of questions about biological development.
Curated OER
The Nucleus-Radioactivity
For this nucleus and radioactivity worksheet, students collect class data and the students represent radioactive atoms decaying. They plot their data and answer two questions about the results. They solve seven problems given the half...
Curated OER
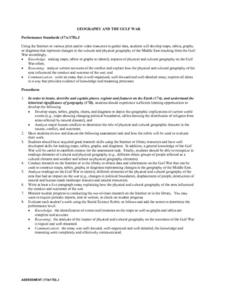
Geography And The Gulf War
Young scholars develop maps, tables, graphs, charts, and diagrams to depict the geographic implications of current world events, and analyze major human conflicts to determine the role of physical and cultural geographic features in the...
Curated OER
Who Represents You?
Students investigate Congress and how individuals are represented in this Country. In this government instructional activity, students complete worksheets research government web sites to determine which senators and congressmen...
Curated OER
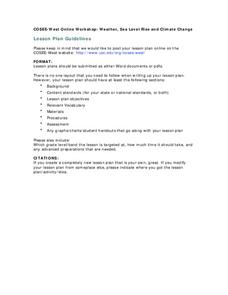
Weather, Sea Level Rise and Climate Change
Eighth graders compare and contrast weather and climate. In this earth science lesson, 8th graders research weather data site and analyze historical data. They present their findings in class and explain identifiable trends.
Curated OER
Seven Up
Middle schoolers investigate the symbolism of the Seven Wonders of the Ancient World, and evaluate modern "wonders of the world." In small groups, they complete a data chart on a selected Wonder, create a poster from the data, and...
Curated OER
Shake, Rattle and Roll
Sixth graders explore the causes and effects of earthquakes. They also collect and analyze data in graphs. They also use the Internet to research earthquakes
Curated OER
Applied Science - Built Environment Lab
Young scholars evaluate trash. For this Science lesson, students collect and weigh trash from their classrooms. Young scholars categorize the trash and the corresponding weights, recording the information on a data sheet.
Curated OER
Water: From Neglect to Respect
The goal of this collection of lessons is to make middle schoolers more aware of the ways in which they are dependent upon water to maintain their standard of living. Learners compare water use in Lesotho to water use in the United...
Curated OER
Seed Germination
Young scholars explore plants and the scientific method. In this plant growth lesson plan, students follow the steps in the scientific method to perform a seed germination experiment as a whole class. Young scholars work in a group to...
Curated OER
What Colors Are Your Skittles?
Students record the numbers of each color in their own Skittles. They compare their results with their partner. Students create a spreadsheet to chart the different colors found in a package of Skittles. They create a PowerPoint...
Curated OER
A Day at the Beach
Student read Sheryl Wilson's story, "A Day at the Beach" while classifying items they find. They design a chart of the items before using educational graphing software to create a graph.
Spartan Guides
Infographics Lesson
An infographic is fantastic way for learners to illustrate their understanding of content, express themselves creatively, and teach others in a manner that is both engaging and informative. While originally designed for a lesson on...
Curated OER
Connecticut Wildlife: Biodiversity and Conservation Status of Our Vertebrate Populations
Students explore the different types of vertebrates found in their area. In this environmental science lesson, students perform a case study on the Common Raven. They analyze data collected from research and create charts and graphs.
Curated OER
Keypals and You
Students collect and compare data received from keypals. They use electronic mail to exchange information with keypals and rrite a paper comparing similarities and differences between themselves and their keypals. In addition, use a...
Curated OER
Trends of Snow Cover and Temperature in Alaska
Students compare NASA satellite data observations with student surface measurements of snow cover and temperature. They practice data collection, data correlations, and making scientific predictions.
Curated OER
Lines of Best Fit
Learners determine if there is an associationm in a scatter plot of data. They analyze data through predictios, comparisons, and applications. Students calculate the line of best fit using a graphing calculator. They display data in...
Curated OER
Different Perspectives of Oregon's Forest Economic Geography
Students map data on employment in wood products manufacturing in Oregon counties. In this Oregon forest lesson, students discover the percentage of people employed in the forest manufacturing industry. Students create a box and whisker...
Curated OER
Using Computers to Produce Spreadsheets and Bar Graphs
Students review graphing terminology and how to plot data points, how to input data into a spreadsheet, and how to make a chart using a computer.
Curated OER
If You're Under Pressure, Blame It On The Air Force
Students complete an experiment in which they demonstrate that air exerts a force. In groups, they create their own siphon and define air pressure. They estimate the time it might take to siphon various amounts of water. They collect,...
Curated OER
Measuring to the Nearest Inch
Third graders use whole numbers and fractions to make connections between abstractions of the mathematical world and the real world. In this fractions and measurement lesson, 3rd graders identify, quantify groups , and measure distances....
Curated OER
Making Good Money Choices
Students identify the needs of their community. In this communities lesson, students use a decision-making model worksheet to determine what community service project they should donate to. Students count the money they have to donate...
Curated OER
Growing Up With A Mission
Student measure heights and graph them using growth charts for which they find the mean, mode, and median of the data set. They graph points on a Cartesian coordinate system.
Curated OER
Twelve Days of Christmas
Learners create charts and graphs using a spreadsheet. They chart the number of each gift given day by day from the song, "The Twelve Days of Christmas." They create a bar graph and a circle graph from their data on the spreadsheet.


