Curated OER
Creating and Analyzing Graphs of Tropospheric Ozone
Students create and analyze graphs using archived atmospheric data to compare the ozone levels of selected regions around the world.
Curated OER
Evaluate Ecosystems
Students collect data from a field study. They write an environmental impact statement and design a plan to improve the ecosystem they have been observing. Finally, they give a presentation on the data and information they have collected.
Curated OER
Heads-Up Probability
Second graders use tree diagrams to predict the possible outcomes of coin tosses. The data they collect and graph also help them predict the likelihood of getting heads or tails when tossing coins the next time.
Curated OER
Watch Over Wild Wanders
Students collect and organize data relating to migratory species and habitats; undertake a habitat action plan, then maintain planting and building projects for continuing benefit to wildlife; understand the unique needs of migratory...
Curated OER
Statistical Specimens
Third graders are introduced to statistical vocabulary. They complete an online activity that asks them to calculate the mean, median and mode for a set of data.
Curated OER
Sea Surface Temperature Trends of the Gulf Stream
Students explore the importance of the Gulf Stream. Using a NASA satellite images, they examine the sea surface temperature. Students collect the temperature at various locations and times. Using spreadsheet technology, they graph the...
Curated OER
Temperature Changes in the Atmosphere
Students analyze how different variables affect atmospheric temperature. They construct a model of an ecosystem, select a variable, design and conduct an experiment, and record and analyze the data to present to the class.
Curated OER
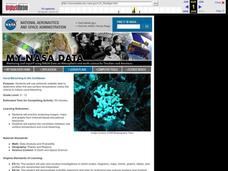
Coral Bleaching in the Caribbean
Students use authentic satellite data on the NASA website to determine when the sea surface temperature meets the criteria to induce coral bleaching.
Curated OER
Checking County Numbers
Learners use their county's information page to gather information about their community. Using the information, they create graphs from the tables provided and interpret the data. They write a paragraph showing their interpretation of...
Curated OER
Dimming the Sun
Students collect, interpret and analyze weather variable data. They describe atmospheric variables that affect evaporation. Students create graphs and analyze the information collected.
Curated OER
It's Your Choice
Students compare data and determine the appropriate way to organize the data. They use physical graphs, pictographs, and symbolic graphs to display their data. In addition, they complete a Venn diagram.
Curated OER
Monster Graph Activity
Seventh graders engage in a instructional activity which take the fear out of graphing. They create and draw conclusions from data found in a Monster graph.
Curated OER
Aruba Cloud Cover Measured by Satellite
Students analyze cloud cover over Aruba. They compose and submit written conclusions which include data, analysis, errors in data collection, and references.
Curated OER
Streamflow
Learners discuss the topic of streamflow and how it occurs. They take measurements and analyze them. They interpret data and create their own charts and graphs.
Curated OER
Mother May I?
Third graders measure distance using nonstandard units of measure. In this measurement lesson, 3rd graders measure a given distance through the use of the game "Mother May I?" Student gather and compare data on how many "giant steps" and...
Curated OER
Bird Bulletins
Students, in groups, create a survey to investigate how much their community knows about birds. They graph their findings using a bar graph. Using the data collected, they develop an advertising campaign to increase community awareness...
Curated OER
Math and Science in a Wetland
Students describe safe practice when doing field and lab investigations in a estuary or wetland. They create a model of an estuary and describe their value and function. They participate in field study in which they collect and analyze...
Curated OER
Fishkill
Students analyze data to determine the effect of thermal pollution on a certain species of fish. They graph temperature and dissolved oxygen and make inferences on the impact a change in temperature could have on the fish. As a class...
Curated OER
Gathering Weather Information
Students watch a video of a recent weather disaster. Using the internet, they work together to examine the weather forecast for tomorrow and next week and discuss why it is important to know the weather. In groups, they use weather...
Curated OER
Perceived Overweight and Actual Weight Risk Classification
Students calculate their BMI and compare it to a healthy weight chart. In this health instructional activity, students compare the perception of overweight with healthy weight charts. Students interpret collected data and evaluate their...
Curated OER
Energy Choices
Students add and multiply decimals to complete gas choice worksheets. They discover which gas supplier has the best gas prices. Students collect and interpret data about local natural gas suppliers and use this information...
Curated OER
Pet Count Excel Graphing
Students used collected data to distinguish what pets they have or would like to have. They correlate findings with appropriate technology--Excel. At the end of the lesson they tabulate a bar chart and present their findings to the class.
Curated OER
Virtual Field Trip/ Gasoline Cost
Young scholars complete a word problem to determine the cost of gasoline per mile of their virtual field trip. They determine the travel time and gasoline costs for two routes and record the information on a data sheet. They check their...


