Curated OER
How Does Your Blue Bonnet Grow?
Learners explore the conditions needed to grow Texas Blue Bonnets. In this Blue Bonnet planting lesson, students recognize the differences in Texas Blue Bonnet. Learners record their findings in a graphs and analyze their results.
Curated OER
Mathematics Module
Delve into graphing! The concepts covered begin with basic graphing basic coordinates and algebraic expressions on coordinate planes, and build up to graphing linear inequalities and equations. Learners solve and simplify various...
Curated OER
Drugged Out Daphnia
Students make predictions and investigate (using a microscope) the effects of nicotine, caffeine, aspirin, alcohol, and sleeping pills on cultures of fresh water Daphnia.
Curated OER
Designing Detectives
Third graders explore the idea of formulating a hypothesis and designing an experiment to test the hypothesis.
Center for Learning in Action
Properties of Balls
Enhance your states of matter lessons with a hands-on science investigation that compares six different balls' color, texture, size, weight, ability to bounce, and buoyancy.
Center for Learning in Action
Water – Changing States (Part 2)
Here is part two of a two-part instructional activity in which scholars investigate the changing states of water—liquid, solid, and gas—and how energy from heat changes its molecules. With grand conversation, two demonstrations, and one...
Center for Learning in Action
Investigating Physical and Chemical Changes
Super scientists visit ten stations to predict, observe, and draw conclusions about the physical and chemical changes that occur when different states of matter—liquid, solid, and gas—are placed under a variety of conditions. To...
Curated OER
Pumpkin Play
Have you ever examined a pumpkin and estimated the number of lines it has? In this math lesson, students count the actual number of lines, record and graph the results. They investigate the circumference, weight and buoyancy of the...
Curated OER
Appearances Are Deceiving
Young scientists study creeks around their area to see how clean the water really is. One way to tell is by the invertebrate populations that are present. This activity introduces a game which learners simulate a variety of species found...
Curated OER
Water Pressure Blaster
Third graders complete an experiment to introduce them to the concept of water pressure. In this water pressure lesson plan, 3rd graders create pressure in a water bottle and observe the force of water that is created.
Curated OER
Ready for Roots
Fourth graders sort seeds and predict what conditions are needed for them to germinate. They keep the seeds moist, observe and measure their growth and graph the results. As the seeds start to grow students compare and contrast the each...
Curated OER
Creating Circle Graphs with Microsoft Excel
Seventh graders will learn how to construct circle graphs using paper and pencil. Then they will learn how to construct circle graphs using Microsoft Excel. This lesson uses technology and shows learners how to cross skills into the...
Curated OER
Exploring Exponential Growth and Decay Functions
Pupils differentiate between exponential growth and decay. In this algebra lesson, students solve exponential equations using properties of exponents. They use the Ti calculator to graph and analyze their functions.
Curated OER
Let the Sunshine In
Ninth graders conduct an experiment which demonstrates the absorption and reflection of sunlight by measuring the heat flow through various window coverings. They predict the relative amount of the sun's heat. Students draw conclusions...
Curated OER
How Do You Get to School?
Third graders talk about all the various ways they get to school. They make a list of all the bus numbers that the students use. They also list all the other methods of transportation used and solidify a hypothesis.
Curated OER
What is the Rock Cycle and Its Processes?
Geology beginners examine three different rock samples and determine their origin by their characteristics. By making and recording observations, they become familiar with features of igneous, metamorphic, and sedimentary rock types....
Curated OER
You Can't Go Wrong with a Right Triangle 2
Upper graders use the properties of right angle trignonmetry to measure objects such as the school flagpole. They solve real world problems using these properties.
Curated OER
Maximize It!
Students design a rectangular box without a lid that has the largest possible volume using the supplied sheet of centimeter graph paper. They work in groups to construct different size boxes to determine the largest possible volume and...
Curated OER
Cover and Boarders
Students find the area and perimeter of rectangular figures. They use this information to find patterns and discover relationships between area and perimeter. Students apply and explain formulas relating to perimeter, area, and volume.
Curated OER
Shadow Casting
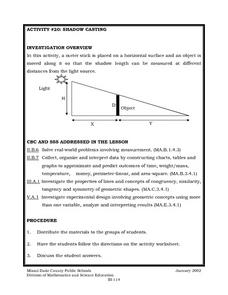
Eighth graders use a meter stick that is placed on a horizontal surface and an object is moved along it so that the shadow length can be measured at different distances from the light source. They solve real-world problems involving...
Curated OER
Graphing Regions: Lesson 2
Students identify and analyze geographical locations of inventors. They each identify where their inventor is from on a U.S. map, discuss geographic patterns, and create a t-chart and graph using the Graph Club 2.0 Software.
Curated OER
Student Costs Graph
Students calculate the mileage, gasoline costs, and travel time and costs for a vacation. They conduct a virtual field trip, and create a comparison graph of costs using Microsoft Excel software.
Curated OER
The Miracle Fish: Learning to Design an Experiment
Students develop procedures to explore the behavior of fish. In this scientific experiment lesson plan students from a hypothesis, write a question, identify different variables and controls in their experiment.


