Curated OER
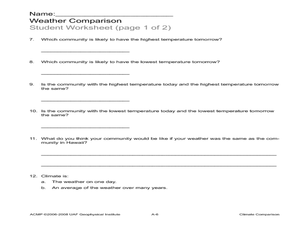
Climate Comparison
Students explore climate regions. In this climate lesson, students examine the climate regions of Alaska as well as the state of Hawaii. Students research selected Internet sources to gather information regarding the climates present in...
Curated OER
Daily Time Ratios
Young scholars track and record how much time they spend on each activity. In this spreadsheet lesson, students apply different functions using Microsoft excel to format cells and calculate the sum of their total time spent each day....
Curated OER
C is for Cookie-A MEAN-ingful Graphing Activity
Third graders, in groups, dissect a variety of brands of chocolate chip cookies and calculate the mean for each brand. They create their own bar graphs, pictographs, and line graphs to represent information.
Curated OER
I am, and this is what makes me special
Students design a PowerPoint presentation using six slides that include a title, a picture and five positive attributes about the student. They include the specified pictures and describe how they relate to themselves.
Curated OER
How Sharp Is Your Memory?
Students play a memory game as they explore reasoning. In this algebra lesson, students identify concepts using pictures and words. They model real life scenarios using hands on manipulatives.
Curated OER
Magnetism and the Magnetic Force
Fourth graders investigate magnetism and the magnetic force.
Curated OER
Lab Report Template
Students write a paragraph (complete sentences) which explains what they did in the lab.
Curated OER
The Media and You
Seventh graders discuss the main purposes of media. Using various advertisements, they identify the method used by the advertisers in each example. They use these methods to create and sell their own product to the class. They use the...
Curated OER
The Dentist
Students read a short story about visiting a dentist. Then they use toothbrushes in order to demonstrate the correct way to brush teeth. Students use the internet to investigate how some foods are healthier for teeth than others. Then...
Curated OER
Russian Dolls Investigation
Students measure a set of Russian dolls using the metric system. In this measurement lesson plan, students identify certain relationships between sets of measurements by measuring a set of Russian dolls and presenting their findings to...
Curated OER
Creating Circle Graphs with Microsoft Excel
Students create graphs of circles. In this geometry lesson, students use Microsoft Excel to create graphs. They construct the graphs using paper and pencil as well as the computer.
Curated OER
Weather Graphs
First graders use their knowledge of weather symbols to organize and construct a graph of the daily weather for one month. Each student have a chance to give the daily weather report using Sammy's Science House Computer Software.
Curated OER
Choosing a Summer Job
What did you do over your summer vacation. Young wage earners must compare summer job options, and determine when each job earn the same amount and what that amount be. This be done by creating, graphing, and solving systems of...
Curated OER
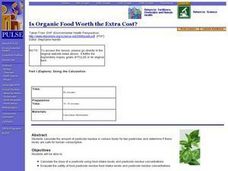
Is Organic Food Worth the Extra Cost?
Young scholars calculate the amount of pesticide residue in selected foods for two
pesticides and determine if these levels are safe. They read an article about a
research study looking for metabolites of these pesticides in children....
Curated OER
Getting To School: Loving It Or Loathe It?
Students engage in a study looking at the problem of transportation to school. They conduct research using a variety of resources. The information is used in order to work together to come up with possible solutions based upon current...
Curated OER
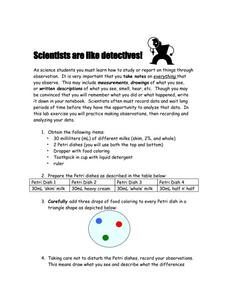
Scientist Are Like Detectives
Students demonstrate proper scientific observation skills. In this investigative science lesson plan, students make observations, record their findings and form conclusions in order to improve their scientific documentation and writing...
Curated OER
Waterworks
Students investigate the water quality of a river. In this water quality lesson plan, students use microscopes, probing devices, and global positioning systems to determine water quality and create presentations on it.
Curated OER
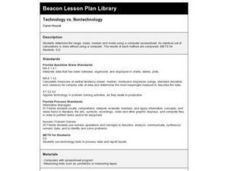
Technology vs. Nontechnology
Fourth graders determine the range, mean, median and mode using a computer spreadsheet. An identical set of calculations is done without using a computer. The results of each method are compared. They calculate the mode, median and range...
Curated OER
All in the (Insect) Family
Students participate in a series of activities in order to explore the diversity of insects. They explore how insects are grouped and categorized.
Curated OER
SkittleGraphs
Second graders discover how to make a bar graph. Each student receives a bag of Skittles candy. They make a bar graph which documents the colors found in the bag. At the end of the lesson, the Skittles are eaten. Fun!
Curated OER
Web-search And PowerPoint Presentations-The Cell
Sixth graders create a PowerPoint presentation using information that they have compiled from their web search and rubric web sites, text and other applicable references. They work in pairs to complete these searches and projects.
Curated OER
Map Scaling
Second graders use a map scale to determine distances between cities in the state of Florida.
Curated OER
Where We Live
Students analyze Canada's population distribution. They access online information to gather demographic information about two Canadian cities. They compare and contrast the quality of life in the two cities and present their findings.
Curated OER
An Introduction to Computer Components
Students experience the first activity in computer servicing by observing computer components. They observe the internal workings of a computer during the lecture section of the activity before dismantling a computer to identify its...


