Curated OER
Math Made Easy
Students evaluate word problems. In this problem solving lesson, students are presented with word problems requiring graphing skills and students work independently to solve.
Curated OER
Graphing Data on Ellis Island
Third graders use data to make a bar graph. In this graphing and social studies lesson, 3rd graders use data about where Ellis Island immigrants came from to complete a bar graph on Microsoft Excel.
Curated OER
Exploration of "Pillbugs"
Fifth graders define vocabulary terms, identify the characteristics of a pillbug, and create a dichotomous key. Then they examine the pillbugs and make observations and record these observations. Finally, 5th graders observe specific...
Curated OER
Hot and Cold Colors
Students experiment with the color and solar energy absorption. In this color and solar energy absorption lesson plan, students spend two days discussing and experimenting with the concept of energy absorption. They paint cans with...
Curated OER
Conditions at Sea Introductory Activity, Making Waves
Students explore waves and wind. In this physical and earth science wave instructional activity, students participate in a wave making activity with an aquarium and a hair dryer. Students complete a data chart recording wave height and...
Curated OER
Sensitive Taste Test
Fifth graders investigate concentrated and diluted solutions by conducting a taste test. In this dilution lesson plan, 5th graders examine the concentration of different juices samples by tasting them and recording their observations....
Curated OER
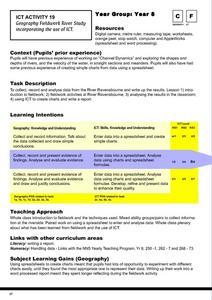
Geography Fieldwork River Study
Eighth graders collect, record, and analyze data from a local river and input the data into the computer. They collect and record the information, discuss the data collected, and enter the data into a spreadsheet and charts to compare...
Curated OER
Using Charts and Graphs to Study East Asia's Modern Economy
Middle schoolers examine East Asia's modern economy. In groups, classmates use the internet to compare the resources, products, and economy of specified countries. After collecting the data, pupils create charts, tables and graphs. ...
Curated OER
MAISA and the REMC Association of Michigan
Students complete online research to study geography's impact on weather. In this geography and weather lesson, students research weather in their city for ten days using an online website. Students bookmark the site, enter data into a...
Curated OER
The Great Pollinators
Students discover the reproductive parts of a plant. In this biology lesson, students identify and categorize several different plants they dissect in class. Students record their information using a data chart.
Curated OER
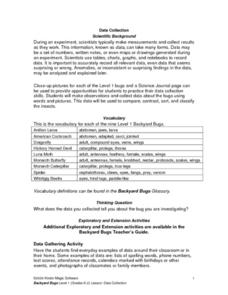
Science: Backyard Bugs Data Collection
Students practice data collection skills by observing common bugs found in their local environment. Once the data is collected they complete data sheets to compare, contrast, sort, and classify the insects. The lesson includes...
Pace University
Grade 7 Earth Day Statistics with Circle and Bar Graphs
Take a tiered approach to studying waste. The lesson uses Earth Day to present differentiated instruction around using circle and bar graphs. Each group gets a cube based on their tiers and works collaboratively as well as individually...
Curated OER
Investigate Pine Creek!
Students are invited to become detectives in this Web-Integrated Science Environment (WISE) as they explore a local creek, its environment and ongoing status. Students participate in field trips, acquisition of data through water testing...
Curated OER
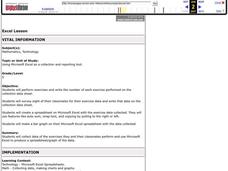
Excel Lesson
Fifth graders will perform exercises and write the number of each exercise performed on the collection data sheet. They survey eight of their classmates for their exercise data and write that data on the collection data sheet. They then...
Curated OER
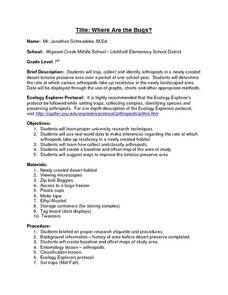
Where Are the Bugs?
Students trap, collect and identify arthropods in a newly created desert tortoise preserve area over a period of one school year. They determine the rate at which various arthropods take up residence in the newly landscaped area. Data is...
Curated OER
Heartbeat Project
High schoolers enter information about their heartbeats into a spreadsheet. They construct data displays and calculate statistics. They describe and justify their conclusions from the data collected.
Curated OER
Seasons and Cloud Cover, Are They Related?
Students use NASA satellite data to see cloud cover over Africa. In this seasons lesson students access data and import it into Excel.
Curated OER
Graphing Pendulum Results
Sixth graders set up a pendulum experiment deciding which variable to manipulate (length of string or weight on the string). They create a hypothesis, collect necessary equipment, and write out each step of their experiment. They then...
Curated OER
Endangered Species
Ninth graders graph data in order to compare the number of extinct species and a rise in human population. They analyze the data collected. Students are encouraged to infer the relationship.
Curated OER
Pick a Pet
Students design informational materials to educate people on the importance of matching a new pet to the family's lifestyle and living arrangements. Students use critical thinking skills to make a decision on the appropriate choice for a...
Curated OER
Old Glory
Learners utilize mathematical concepts such as: measurement, ratio and proportion and geometric probability to analyze the components of the U.S. Flag. They collect, organize and interpret data by constructing charts, tables and graphs...
Curated OER
Positive Future Fair Project
Ninth graders view the film "Pay It Forward" and discuss what kind of public campaign is needed to move people to positive action. They consider different ways of presenting information (graphs, visual displays, etc.) as tools for...
Curated OER
From There To Here...
Young scholars find out where some of the products in hour homes come from, then become aware of our local trash, landfills and incinerators. They chart and graph data and use maps for different purposes.
Curated OER
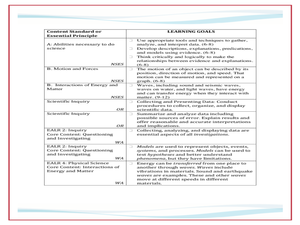
Documenting Science Through an Active Inquiry Process
Students follow procedures regarding scientific data collection. In this scientific inquiry lesson, students investigate inquiry questions through research and data collection. Students use technology tools to create products that...


