EngageNY
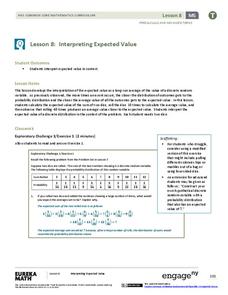
Interpreting Expected Value
Investigate expected value as a long-run average. The eighth installment of a 21-part module has scholars rolling pairs of dice to determine the average sum. They find aggregate data by working in groups and interpret expected value as...
Beyond Benign
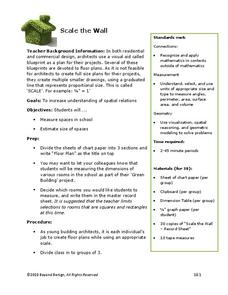
Scale the Wall
How can you fit an entire school on one sheet of paper? You use scale! Scholars measure rooms in the school and, using the correct scale, design a floor plan that includes area calculations with their data.
Curated OER
Ketchup to Collecting Data
First graders collect data for a survey of 3 brands of ketchup and create class charts. They taste test three different brands of ketchup, and use the data to create a presentation. Tasty lesson!
Curated OER
Coming to America: U.S. Immigration
Analyze primary source documents relating the conditions under with prompted American immigration. Learners will analyze information in order to create a six-panel pamphlet. Much of the lesson is not available but the key objectives are....
Curated OER
Gravity Versus the Mighty Egg
Students design, revise and construct a method for protecting an egg from cracking when it is dropped from a height. They work in small groups to develop their protection method and then collect and analyze data as a class when each...
Curated OER
Grade 1: More Land or Water?
First graders listen as the teacher reads a story involving cross-continent traveling. Students collect a random sample by tossing an inflatable globe and recording whether they touch land or water each time they catch the globe in order...
Curated OER
Creating a Graph
Students brainstorm favorite things to do during the summer. They survey classmates to collect data, arrange it in a chart, and create graphs using ClarisWorks.
Curated OER
The Life Cycle of the Mealworm
Fourth graders provide a habitat for live mealworms and observe their life cycle. In this animal life cycle and scientific inquiry lesson plan, 4th graders create a habitat for a live mealworm and observe and record related data as it...
Curated OER
Osmosis and the Cell Membrane-part 2
Young scholars participate in a review of diffusion and the basic properties of the cell membrane before exploring the process of osmosis in a lab activity. Using shell-less eggs that have soaked in various solutions, students make...
Curated OER
Biospheres in Your Backyard
Students collect data from a local river biome. They use the information for metric conversion and graphing equations. They study the components of what makes up a biosphere and how math is used to analyze one.
Curated OER
Graphing Family Reading Habits
Second graders collect data from their families about their reading habits and graph them. In this graphing family reading habits instructional activity, 2nd graders interview family members about their reading habits. They then use a...
Curated OER
Plastic Packaging
Students collect data. In this math instructional activity, students collect data about recyclable materials. Students develop a plan that will help the environment. Recycling plastic containers is discussed.
Curated OER
Risk Assessment and Geometry
Tenth graders study the concept of risk analysis as it relates to geometry. For this spatial relationship lesson, 10th graders are provided a set of coordinates to analyze a piece of land described. Students write a description that...
Curated OER
Graphing
Fifth graders practice using math graphs. In this graphing instructional activity, 5th graders work in groups to develop a topic of their own to represent as a graph. Students collect data and construct a graph for the instructional...
Curated OER
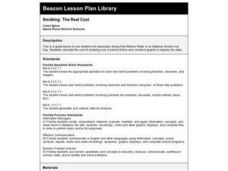
Smoking: The Real Cost
Third graders discuss the adverse effects of smoking and predict the financial cost of a smoking habit. They collect data regarding the cost of a pack of cigarettes and average packs smoked a day. They create bar graphs displaying the...
Curated OER
Survey Project
Eighth graders create a website using FrontPage. They use inserted forms to collect survey information and use Microsoft Excel and MS Word to create a presentation of the survey and the results.
Curated OER
Candy Bar Survey
Second graders investigate the skill of graphing data by using candy bars to create context for the lesson. They use technology for graphing and organizing information like a spreadsheet. The lesson includes a resource link to aid in the...
Curated OER
Where do Plants Get their Food?
In this where do plants get their food worksheet, students design an experiment that will disprove the idea that plants obtain their food from soil. Students will set up their experiment and design a data table that will record data over...
Curated OER
Murder in the First Degree - The Death of Mr. Spud
Secondary learners investigate exponential functions in a real-world scenario. They collect data on the temperature of a cooling baked potato, enter the data into lists, and graph the data using a scatter plot before finding an...
Institute of Electrical and Electronics Engineers
Get Connected with Ohm's Law
Ideal for your electricity unit, especially with middle schoolers, this lesson plan gets engineers using multimeters in electrical circuits to explore the relationships among voltage, current, and resistance. Older learners may even plot...
Curated OER
How Dense is Salt Water?
Young schoolers explore the concept of linear regression. They determine the mass and density of salt water. Pupils add salt to water and record the density as salinity increases, and perform a linear regression on the data to model the...
Curated OER
Pollution and Environmental Studies- Daily Water Use
In this environmental studies worksheet, students create a data table to discover how much water each person uses on a daily basis and what it is used for. They complete a post activity to make and test solutions for pollution using a...
K20 LEARN
A Trait Accompli: An Introduction to Mendelian Genetics
Young scientists learn the laws of genetics through data collection and research. They use discussions and online resources to develop an understanding of the related vocabulary.
Curated OER
All About Aid
Begin this lesson by estimating the cost of a college education and comparing it to actual data. After reading an article, high school seniors discuss the processes of the college loan corporations. They listen to a lecture about how to...


