Curated OER
Data Analysis Using Technology
Analyze data using technology. Middle schoolers design data investigations, describe data, and draw their own conclusions. Then they select the best type of graph, graph and interpret the data, and look for patterns in trends. They also...
Curated OER
Data Collection
Students write a journal exercise that relates to pets. They collect information from each other in order to practice making and interpreting bar graphs. They Continue building different kinds of graphs with the group.
EngageNY
Graphs of Exponential Functions
What does an exponential pattern look like in real life? After viewing a video of the population growth of bacteria, learners use the real-life scenario to collect data and graph the result. Their conclusion should be a new type of graph...
NASA
Exploring Data
Bring the sun to your class! Young scholars analyze actual solar wind data in the second lesson of a five-part series. Their analysis includes speed, temperature, and density data.
Curated OER
Look Into My Eyes!
Students explore collecting, analyzing, and graphing information. They collect data on the various eye colors of their classmates. Students tally the results and create a graph.
Chicago Botanic Garden
Plant Phenology Data Analysis
Beginning in 1851, Thoreau recorded the dates of the first spring blooms in Concord, and this data is helping scientists analyze climate change! The culminating instructional activity in the series of four has pupils graph and analyze...
Willow Tree
Bar Graphs
Circles, lines, dots, boxes: graphs come in all shapes in sizes. Scholars learn how to make a bar graph using univariate data. They also analyze data using those bar graphs.
Willow Tree
Circle Graphs
Pie isn't just for eating! Scholars learn to create pie charts and circle graphs to represent data. Given raw data, learners determine the percent of the whole for each category and then figure out the degree of the circle that percent...
Statistics Education Web
First Day Statistics Activity—Grouping Qualitative Data
Making groups of groups can help to organize data. Classes use statistics to group themselves using descriptive adjectives. The objective is for learners to understand that grouping qualitative data is useful when the original groups are...
Curated OER
Numbers and Me
Students collect and graph data about themselves. In this collecting and graphing data lesson plan, students poll their classmates about how many siblings they have or they measure their height. Students make a bar graph of their data....
Alabama Learning Exchange
Ice Cream Sundae Survey
Young scholars analyze data through graphs. They will complete a class survey on ice cream sundaes and tally and graph the responses. They then analyze the information from the class graph.
NOAA
Graphing Temperatures
Battle of the hemispheres? In the fourth installment of a five-part series, young oceanographers use the NOAA website to collect temperature data from drifters (buoys), one in the Northern Hemisphere and one in the Southern Hemisphere....
Curated OER
Exploring Quadratic Data with Transformation Graphing
Using a data collection device to collect data regarding a bouncing ball, students use various features on graphing calculators to experiment with the parameters of the vertex form of the parabola and their effect on the shape of the...
Code.org
Good and Bad Data Visualizations
Good versus bad data. Pairs rate online collections of data representations from good to bad and then suggest ways to improve the visualizations. The class then creates a list of best practices and common errors in data representations...
Curated OER
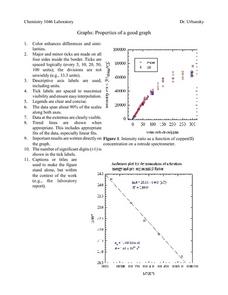
Properties of a Good Graph
For this chemistry worksheet, students examine the common characteristics of an acceptable graph that is meant to be used to display data.
Curated OER
Data Squares
Middle and high schoolers examine how data squares organize and sort information and data sets. They discuss examples of data squares, complete a data square about themselves, organize the data squares for the class together, and compile...
Pace University
Grade 7 Earth Day Statistics with Circle and Bar Graphs
Take a tiered approach to studying waste. The lesson uses Earth Day to present differentiated instruction around using circle and bar graphs. Each group gets a cube based on their tiers and works collaboratively as well as individually...
Curated OER
Are We Couch Potatoes or Busy Bees? Data Analysis of Physical Activity in School
Young scholars study practical data analysis within the constraints of the scientific method. In this data lesson plan students collect and enter data into a computer spreadsheet then create graphs.
Curated OER
Data Analysis: Infiltration Rate and Composition of Concrete
Students collect and graph data. In this statistics lesson, students analyze data using a spreadsheet program. They display their data effectively and analyze it.
Curated OER
Graphs and Data
Students investigate poverty using graphs. In this algebra lesson, students collect data on the effects of poverty and use different rules to analyze the data. They graph and use the trapezoid rule to interpret the data.
Curated OER
Collecting Data and Graphing
Young scholars practice collecting and graphing data using interlocking cubes. In this graphing lesson plan, partners count cubes and graph them. They also use a meter stick to measure arm span and height then compare the results with...
Curated OER
Red Worms Rock!
Second graders measure red worms. In this lesson, 2nd graders observe and collect data on red worms. Students measure the red worms and create a graph with the data they collect.
Curated OER
A Day at the Beach
Help learners determine the rate of change for the temperature of sand. They will collect data on the temperature of wet and dry sand over time with a heat lamp overhead. Then make a scatter plot of the data and find a linear model to...
Curated OER
Survey Says...
Young statisticians collect, organize, and present data to illustrate responses to a survey question. They write and conduct the survey. They finish by presenting the results in the form of a graph.


