Curated OER
The Dog Days of Data
Students practice an alternative form of data presentation. They practice sequencing data, identifying the stem-and-leaf, creating stem-and-leaf plots, and drawing inferences from the data by viewing the plots.
Curated OER
Recording Data From a Survey Reteaching Worksheet
In this recording data from a surveys reteaching worksheet, 2nd graders review the use of tallies when recording data. They use the information to make a data table and a bar graph that displays the information.
Curated OER
Line Graphs and Commercial Costs
Students investigate line graphs. For this middle school mathematics lesson, students compare and contrast different types of graphs and create line graphs based on the data provided.
Curated OER
Graphing Our Favorites
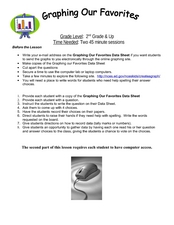
Second graders use a computer program to follow directions and graph their favorite things into a bar graph. In this graphing lesson plan, 2nd graders have 30 choices of favorite things to graph.
Curated OER
Make Line Graphs
In this graphing worksheet, 5th graders use 2 line graphs to answer 4 word questions. They use data from two charts to make a single and a double line graph.
Curated OER
Pumpkin Seed Data!
Second graders work with pumpkins to estimate, then accumulate data about pumpkin seeds. After cleaning out the pumpkins, 2nd graders utilize a worksheet imbedded in this plan which has a variety of pumpkin math activities they can do.
Curated OER
Evaluating Data
In this data worksheet, students learn how to organize the data collected during an experiment and practice finding patterns. Students graph a table of experimental data and complete 1 short answer question.
Curated OER
Graphing Conversation Hearts
Students collect data and create a graph. In this mathematics lesson plan, students separate paper hearts by color and create a graph showing the number of hearts of each color present. Students receive a handful of candy hearts that...
Curated OER
Just Graph It!
Students practice collecting data and organizing it into graphs. As a class, they collect birthday information from each of their classmates. To continue practicing, they examine the characteristics of different bugs and zoo animals. ...
Curated OER
Graph a Panther's Diet
Pupils examine the diet of panthers. In this interpreting data instructional activity, students collect data on the panther's diet and chart the data in bar and pie graphs.
Curated OER
Olympic Line Graphs
Sixth graders examine how to make line graphs. In this Olympic line graph lesson students make line graphs and search the given Internet sites to find data on their summer Olympic Game.
Curated OER
Why Data
High schoolers investigate and discuss why data is important. In this statistics lesson plan, students collect, graph and analyze data. They apply the concept of data and lines to finding the rate of change of the line created by the data.
Curated OER
Histograms and Bar Graphs
Students are introduced to histograms, bar graphs, and the concept of class interval. They use an activity and three discussions with supplemental exercises to help students explore how data can be graphically represented (and...
Curated OER
Simple Bar Graphs Using Excel
Students create original survey questions, and develop a bar graph of the data on paper. They input the survey data using two variables onto an Excel bar graph spreadsheet.
Curated OER
Creating Graphs from Tables
Students interpret data from tables and then create a graph to show the same data in a different organization.
Curated OER
Bar Graphs
Seventh graders visually represent and analyze data using a frequency table. They recognize what values in a data set are bigger by looking at a bar graph and answer questions about certain bar graphs and what they represent. Students...
Curated OER
Charting and Graphing Sales
Students analyze and represent weekly sales figures using tables, bar graphs, and pie charts. They draw conclusions using bar graphs and pie charts. Students are told that each day at school they have the option of buying or bringing a...
Curated OER
Collecting And Organizing Data
In this collecting and organizing data worksheet, students, with a partner, problem solve and calculate the answers to six mathematical word problems.
Curated OER
Collecting Data
In this algebra worksheet, students collect and analyze data. They graph and identify their solutions. There is one question with an answer key.
Curated OER
Creating Circle Graphs with Microsoft Excel
Students create graphs of circles. In this geometry lesson, students use Microsoft Excel to create graphs. They construct the graphs using paper and pencil as well as the computer.
Curated OER
Skittle Graphing (Lesson Plan)
Students discuss the uses of graphs. They use color candies to count and sort before designing graphs. They label the graph papers with appropriate titles and candy colors. They complete the graph bars, and discuss the results with a...
Curated OER
Collect and Organize Data: Reteach
In this data collection worksheet, students learn the parts of a tally chart and how it organizes information. Students then use the second tally chart to help them answer the six questions.
Curated OER
Collect and Organize Data: Homework
For this collecting and organizing data worksheet, students use the tally chart for the students' eye color to answer the first two questions. Students then survey their family for eye color, record those results in a tally chart, and...


