Howard County Schools
Planning for Prom
Make the most of your prom—with math! Pupils write and use a quadratic model to determine the optimal price of prom tickets. After determining the costs associated with the event, learners use a graph to analyze the break even point(s).
Radford University
Got Slope?
Go around and around with slope. The class investigates tornadoes by watching videos, building a homemade tornado, and performing research on the Storm Prediction Center website. Groups gather data and create scatter plots for twisters...
Curated OER
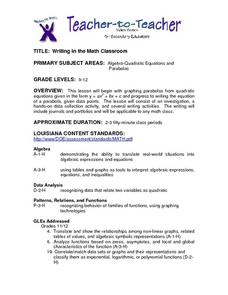
Writing in the Math Classroom
Students determine the vertex, y-intercept and direction of a parabola and write an explanation of how to graph a parabola. They collect and graph data using a calculator.
Curated OER
Computer Graphing
Students research the Internet or create surveys to find graphable data. They collect, organize, analyze and interpret the data. Finally, they choose the appropriate type of graph to display the data and find the measures of central...
Curated OER
Round and Round and Round We Go!
Students investigate motion using a CBL. In this algebra instructional activity, students collect and graph data on a coordinate plane. They define and identify amplitude and period of conic graphs.
Curated OER
Collecting Data
Fifth graders collect and describe data. Through various inquires, they collect information and describe it in graph form. Students predict information, find the actual amount based on their data and compare their findings with their...
Curated OER
Graphing Data on Ellis Island
Third graders use data to make a bar graph. In this graphing and social studies lesson, 3rd graders use data about where Ellis Island immigrants came from to complete a bar graph on Microsoft Excel.
Curated OER
Cartesian Coordinates
Students investigate rational numbers through data analysis and statistics. In this algebra instructional activity, students represent, rename, compare and order rational numbers. They collect and represent data correctly on a graph.
Curated OER
Data Analysis of Ground Level Ozone
Sixth graders construct and interpret graphs from ozone data collected in Phoenix area. Can be adapted to other areas.
Curated OER
Graphing Iron Data
Students apply a data set to create a graph show how iron ore impacts an ecosystem. They explain how the iron effects the distribution and abundance of phytoplankton in coastal ecosystems using spreadsheet software.
Curated OER
Graphing Pendulum Results
Sixth graders set up a pendulum experiment deciding which variable to manipulate (length of string or weight on the string). They create a hypothesis, collect necessary equipment, and write out each step of their experiment. They then...
Curated OER
Probability Experiment Simulation: Design and Data Analysis Using a Graphing Calculator
Seventh graders simulate probability experiments. Using a graphing calculator, 7th graders design, conduct, and draw conclusions from simulations or probability experiments. Students construct frequency tables and compare the...
abcteach
What is Your Favorite Month?
A simple worksheet that helps learners conduct a survey is here for you. In it, pupils collect data on their family and classmate's favorite months. Youngsters use tally marks in the spaces provided to keep track of the answers. Once...
Curated OER
DATA ANALYSIS OF GROUND LEVEL OZONE
Sixth graders construct and interpret graphs from ozone data collected in the Phoenix area.
Shodor Education Foundation
Graphing and the Coordinate Plane
Ready to introduce your class to the coordinate plane? This website includes a detailed lesson plan that includes two interactive games to help learners practice graphing ordered pairs. The scripted discussion is a little cheesy and a...
Curated OER
Creating Circle Graphs with Microsoft Excel
Seventh graders will learn how to construct circle graphs using paper and pencil. Then they will learn how to construct circle graphs using Microsoft Excel. This lesson uses technology and shows learners how to cross skills into the...
Curated OER
Confidence Levels
Learners collect data and graph it. In this statistics lesson, students rate confidence levels by collecting data and analyzing it. They graph their findings on the Ti calculator.
Curated OER
Aerosol Lesson: Science - Graphing SAGE II Data
Students examine and plot atmospheric data on bar graphs.
Curated OER
What Are Your Favorite Apples?
In this tally worksheet, students take a survey to determine the favorite apple. They write tally marks beside the apple chosen. For elementary students, this worksheet may be used for counting purposes and to reinforce what a tally mark...
Curated OER
Wind Through Your Socks
Students collect and graph data. In this algebra lesson, students investigate speed and distance and their application in the real world. They relate concepts of algebra and geometry as it relates to distance, vectors and speed.
Curated OER
Graphing Calculator Activity: Multiplying and Dividing Mixed Numbers
In this graphing calculator learning exercise, students explore necessary steps to multiply and divide mixed numbers using a graphing calculator. In groups, students measure objects in their classroom and write equations using their...
Curated OER
Graphing Your Favorite Pizza Topping
Fifth graders can survey the students just in their classroom, the grade level, or other grade levels. Upon finishing the surveys and compiling the data, the students can input their results in an Excel template or create their own...
Curated OER
What Color Are Your Eyes?
In this color of eyes activity, students conduct a survey to determine the number of students who have brown, hazel, blue or green eyes. The information is collected and then the data is organized. Students may use the data to create...
Curated OER
Looking at Data
Third graders use two days to create, collect, display and analyze data. Classroom activities and practice build greater understanding to a variety of forms used to display data.


