Curated OER
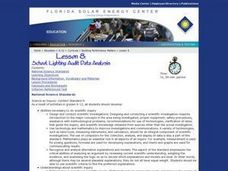
School Lighting Audit Data Analysis
Students analyze the data collected in the school lighting audit. They work together to write recommendations for more efficient lighting for their school. They practice using new vocabulary and working together with others.
Curated OER
Graphing Linear Equations
Ninth graders review the information that they have already learned
with regard to linear equations and graphical representations. They then assist in combining equations with a graphical element and complete various graphs with this...
Pennsylvania Department of Education
Multiplication Represented as Arrays
Third graders collect data about themselves and use in a line plot. In this analyzing data instructional activity, 3rd graders collect various sets of information,create a line plot and compare the data. Students complete a worksheet on...
Curated OER
Learning in Cockroaches
Learners make scientific observations. In this stimulus response lesson, students make observations and collect data to determine if cockroaches can learn. A secondary purpose of this lesson is to provide learners with the opportunity to...
Curated OER
Graph the Presidents At Inauguration- How Old Were They?
Learners construct a graph of the presidents' ages at inauguration. In this U.S. history instructional activity, students use online resources to gather data about the presidents and accurately present their results on a graph.
Curated OER
Comparing Linear and Exponential Data
Learners graph linear and exponential equations. In this algebra instructional activity, students differentiate between linear and exponential equations. They relate it to the real world.
Curated OER
The Life Cycle of the Mealworm
Fourth graders provide a habitat for live mealworms and observe their life cycle. In this animal life cycle and scientific inquiry lesson plan, 4th graders create a habitat for a live mealworm and observe and record related data as it...
Curated OER
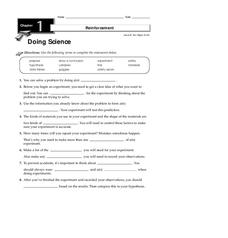
Doing Science
In this science experiment process worksheet, students will learn about the steps of conducting a science experiment, including creating a hypothesis, collecting data and drawing a conclusion. This worksheet has 8 fill in the blank...
Curated OER
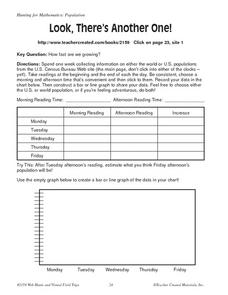
Look, There's Another One!
In this math worksheet, learners spend a week collecting information on either the word or U.S. populations from the U.S. Census Bureau Web site. Students record their data in a chart and bar graph. Learners also use the website to...
Curated OER
Virtual Field Trip
This hands-on resource has future trip planners analyze graphs of mileage, gasoline costs, and travel time on different routes. While this was originally designed for a problem-solving exercise using a Michigan map, it could be used as a...
Curated OER
Elementary Statistics in Life
Students examine newspapers for graphs. They collect and sort data that is of interest to them. They enter data into a database and make comparisons using the information.
Curated OER
Graphs Abound
Young scholars create a survey for their classmates to collect data on their favorite foods, eye color, pets or other categorical data. They compile the data from the survey in a table and then make a bar graph of each category using a...
Curated OER
Graph It!
First graders use organized data to construct real object graphs, picture graphs, and bar-type graphs.
Curated OER
M&M Graphing and Probability
Students create a variety of graphs. They count, sort, and classify M&M's by color and record data on a chart. They use data from the chart to create pictographs, bar graphs and circle graphs. They analyze data and determine...
Curated OER
Data Days
Sixth graders practice collecting, organizing and displaying data. They create circle, bar, line and picto graphs. They analyze data in small and large sample groups.
Curated OER
Graphing Pockets
Second graders explore graphing. They count the number of pockets on their clothes and use Microsoft Excel to enter their data. Students create a class graph displaying their findings.
Curated OER
Leaf Worksheet
In this leaf classification worksheet, students count the number of leaves and write the number in the color column for each day leaves were collected. Students then answer the four questions.
Curated OER
Graphing a Survey
In this mathematical worksheet, students survey a selection of thirteen people to find out if they like to eat ice cream, cakes or pies and then fill in their graphs with the data they've collected.
Curated OER
Compare Sets of Objects Guided Lesson
Practice math vocabulary terms fewer, more, and data using this visual-object-analysis guide. Learners observe three sets of objects and answer three questions, two of which compare numbers of objects, and the last which asks scholars to...
Curated OER
Are You My Little Peanut?
Fourth graders explore the mass and length of peanuts by pretending to parent a peanut. In this mode, median and range lesson students graph their measurements and then use them to find the mode, median and range. Students discuss peanut...
McGraw Hill
Population Biology
The carrying capacity of an environment varies based on the organisms that live there. Using a virtual lab simulation, scholars test two protists living in their own environments and a third environment where both protists live. They...
Curated OER
The Power of a Project
How does PBL differ from a basic thematic unit? Discover the answer to this important question. A bulleted comparison is made between each type of teaching method, example projects are included, and a full "how to" is laid out in an easy...
Radford University
Projectile Motion and Quadratic Functions
Model the flight of a ball. Small groups collect time data for how long it takes to toss a ball between two people. The teacher leads a discussion about projectile motion to get the class thinking about how to calculate the equation of...


