Curated OER
Do Caterpillars Eat More As They Get Bigger?
Learners observe caterpillar behavior and the amount of milkweed leaves the caterpillars eat each day. They collect data regarding the caterpillar's size and anything else they see. They look for patterns in caterpillar eating habits and...
Curated OER
Drip, Drip, Drip or The Case of the Leaky Faucet
Students explore the cost of wasted water. In this math lesson, students conduct an experiment in which they collect data on how much water is lost when a faucet leaks. Students figure the cost of the water that was wasted.
Curated OER
It's 'ELEMENT' ary
Middle schoolers, using a Web site about the periodic table of elements, create spreadsheets representing elements and their properties. They also create graphs that compare the physical properties of the elements.
Curated OER
What's the Weather?
Second graders make daily weather observations, record them with appropriate stickers on a chart, and then summarize them at the end of the week in the form of a bar graph.
Curated OER
Analyzing Motion of a Tossed Ball
Students investigate the parameters involved with launching a basketball at an angle. In this motion lesson students predict and sketch graphs that show the motion of a ball toss.
Curated OER
Boxplots Introduction
Students describe the pattern of a bell curve graph. In this statistics lesson, students move data around and make observation about the mean, and the quartiles. They define boxplot, outlier, range and other important vocabulary words...
Curated OER
Months of the Year
Students practice interviewing. In this months of the year lesson, students interview at least five adults working in their school to gather data on when their birthdays occur. Students create a master calendar for the school.
Curated OER
Role-Playing Jean Talon
Learners explore New France. In this New France lesson, students examine census data compiled by Jean Talon in 1665 and 1666. Learners take on the role of Talon trying to convince the King of France to increase his investment in New...
Curated OER
SkittleGraphs
Second graders discover how to make a bar graph. Each student receives a bag of Skittles candy. They make a bar graph which documents the colors found in the bag. At the end of the lesson, the Skittles are eaten. Fun!
Curated OER
Probing Under the Surface
Eighth graders use a measuring stick to determine the shape of the inside of the bottom of a box, then apply their knowledge to an additional situation. This task assesses students' abilities to make simple observations, collect and...
Curated OER
What is a Box and Whisker Plot?
Eighth graders explore the correct use of box and whisker plors. The times when they are appropriate to use to compare data is covered. They plot data according to statistical analysis including mean, median, and mode.
Curated OER
A Thanksgiving Survey
Students conduct a survey. In this math lesson, students design and conduct a survey about Thanksgiving foods. Students display the collected data in a graph and use the graph to determine what food to serve for a Thanksgiving meal.
Curated OER
Being an Educated Consumer of Statistics
Students examine kinds of data used to report statistics, and create their own statistical report based on any of the four sources of media information (Internet, newspaper, TV, magazine).
Curated OER
Math: Football Fever Fun
Students compile statistics from high school or other football team and construct a spreadsheet on which to record their findings. Using Chart Wizard to analyze the data, they construct charts and graphs for a visual display of the...
Curated OER
Applied Science-Science and Math (2A) Post Lab
Second graders create a graph about TV watching. In this bar graph lesson plan, 2nd graders make a hypothesis about how much TV 2nd graders watch per week. They record their TV watching for a week and bring it to school to create a class...
Curated OER
Significant Science: Statistics for Planet Earth
Ninth graders discover how statistics are used to interpret results of scientific experiments. Students write hypotheses and test the hypotheses by collecting data and organizing the data. Students graph their data to produce a visual....
Curated OER
Mean Meadian and Mode
Students apply central tendencies to given data. In this statistics lesson, students calculate the mean, median, and mode as it relates to their data. They collect data and graph it while identifying the way the numbers are ordered.
Curated OER
Be the Kiwi
Students analyze linear equation. In this algebra lesson, students analyze and graph data. They solve problems involving linear equations and graph lines using the slope and y intercept.
Curated OER
The Phone Bill Problem
Students write an equation for a linear function. In this algebra lesson, students collect data, plot it and graph it. They identify the equation of the graphed data and define the slope and y-intercept of the graph.
Curated OER
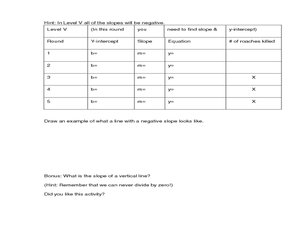
Cockroach Slope
Students identify the slope of linear functions. In this slope lesson, students collect data and graph it. They write equations with no more than two variables and use technology to explain their data.
Curated OER
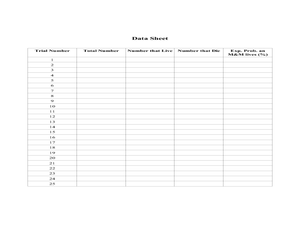
RIP M&M's
Students solve theoretical probability problems. In this algebra lesson, students apply the concept of probabilities to solving real life scenarios. They collect data and graph it using experimental probability.
Curated OER
Weight Training
Young scholars conduct a class-wide survey collecting, compiling, and analyzing data about fitness, weight loss, and body image issues. They analyze the relationship between exercise and diet in weight control.
Curated OER
The World Population: Logistic Model
Learners explore the various uses of the logistic function. Students use the internet to collect world population data and find a logistic model for their data and use their chosen model to predict future populations.
Curated OER
Biological and Agricultural Engineering
Eighth graders explore mathematics by conducting a series of investigations using a colorimeter. In this math lesson, 8th graders explain the purpose of food irradiation. They collect data and graph them.


