Curated OER
Graphing Favorite Holidays
Students create spreadsheets and bar graphs based on results of survey of favorite holidays.
Curated OER
Chucky Chickadee's Bird and Breakfast: Sing in Please
Students observe bird feeding and complete a tally and graphing activity for their observations. In this bird graphing lesson plan, students work in teams to observe bird feedings. Students complete a bird reporting sheet and collect...
Curated OER
Weather "Whys"
Students complete activities to explore fall weather. In this weather lesson, students use the given links to examine weather forecasts. Students complete a weather graph activity and watch Internet field trips. Students complete fall...
Curated OER
Understanding Statistics
In this statistics worksheet, students examine and interpret pictographs and line graphs. Students analyze the provided data in order to create bar graphs, circle graphs, and box and whisker plots. The nine page worksheet accompanies a...
Curated OER
"The Outsiders" by S.E. Hinton
Middle schoolers estimate the distance in miles between Tulsa, Oklahoma and Manhattan, Kansas. They gather and graph data on gangs in both areas.
Curated OER
Cindy and Linda Selling Lemonade
In this graphing worksheet, learners read a graph, complete a chart about the information, and answer questions. There are fifteen questions in all.
Curated OER
Dynagraphs
Students collect and graph their data. In this precalculus lesson, students identify the input and out of a function. They find the domain and range and the inverse of a function.
Curated OER
Creating a Spreadsheet
Students create a spreadsheet using ICT. In this algebra lesson, students collect and graph their data using a spreadsheet. They find solution to a given problem using trial and error.
Curated OER
Graphing Data - Temperature
Seventh graders measure and record temperature over a given time period. They compare the recorded temperatures to the 40-year recorded normal average temperatures for the same area. Students display and interpret their findings in a graph.
Curated OER
Graphing With a Spreadsheet
Fourth graders review how to create bar, line and circle graphs. Using jelly beans, they collect data and present it in a bar graph form. They enter the same data into a spreadsheet and watch as the program creates the same graph. They...
Curated OER
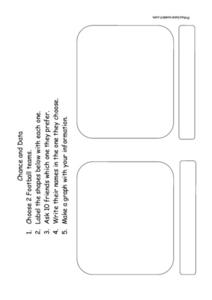
Chance and Data - Data Collection
In this data and probability worksheet, students choose two football teams and label the graphic organizer. They question 10 friends as to which team they prefer and write their names in the organizer. They make a graph that displays the...
Curated OER
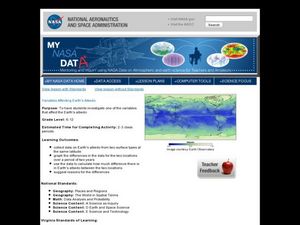
Variables Affecting Earth's Albedo
Students study the variables that affect the Earth's albedo. In this environmental data analysis lesson plan students interpret and graph information and calculate changes.
Curated OER
Ghostbusting in the Chesapeake
Ghost pots, fishing gear lost during crabbing expeditions, continue to trap crabs that are never collected. Increase your budding ecologists' awareness of human impact on the environment as well as conservation efforts using this...
Curated OER
Scientific Method- "The Big Ahah"
Students experiment with water, dropper and a coin to study the scientific method. In this scientific method lesson plan, students are in groups, each with a coin, water and a dropper. They investigate how many drops of water can fit on...
Curated OER
Dinosaur Tracks: From Stride To Leg Length To Speed
Students determine the relationship between leg length, stride length, and speed in humans and bipedal dinosaurs. They collect data and graph these human characteristics then use actual data collected from dinosaur track pads and fossils...
Curated OER
Energy and Changes of State
Young scholars complete a variety of labs to help them explain how energy affects the changes in states of matter. They also be required to collect and record data, graph data, and apply interpretations of that data.
Curated OER
Weather "Whys" Lesson 2 Seasons
Young scholars explore seasons. In this cross curriculum weather and seasons lesson plan, students identify characteristics of the four seasons and sequence related pictures. Young scholars listen to poems and stories about trees in...
Curated OER
Rain On
Fourth graders study the water cycle and clouds. In this water cycle and cloud lesson, 4th graders determine the definition of condensation and watch a demonstration in which the teacher makes a cloud in a bottle. They discuss the water...
Curated OER
Let's Get Physical
Students collect data using the CBL. For this statistics lesson, students predict the type of graph that will be created based on the type of activity the person does. The graph represents heart rate depending the level of activity.
Curated OER
Ocean Temperatures
Students list data collected by marine buoys and the different kinds of moored buoys. They describe how data is transmitted worldwide. They explain the difference between near shore and offshore air and water temperatures.
Curated OER
Gingerbread Man Math
Students collect and explore gingerbread man data. In this math and technology lesson plan, students examine how to organize and interpret data in three formats: objects, pictures, and graphs.
Curated OER
M & Ms in a Bag
Students make predictions about the number and colors of M&M's in a snack size package. They create an Excel spreadsheet to record the data from their small group's bag, create a graph of the data, and discuss the variations of data...
Curated OER
Show Me!
Students analyze and interpret graphs. In this graphing lesson, students view a video and construct their own graphs (line, circle, bar) from given sets of data.
Curated OER
Candy Colors: Figuring the Mean, Median, and Mode
Students count candy by color and then calculate mean, median, and mode. They count candy and use the data to calculate mean, median, and mode (by color) and apply their learning to another collection of data.


