Curated OER
What's Your Speed?
Learners explore the concept of distance v. time. They use a CBR to collect data on their distance over time, then plot their data using a scatter plot and find an equation to model their data. Pupils discuss what if scenarios which...
Center Science Education
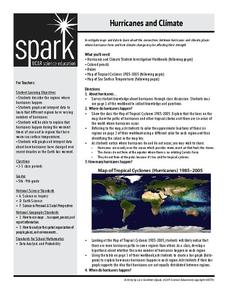
Hurricanes and Climate
Feeling under the weather? This lesson on hurricanes can whip things up! With professionally designed maps and handouts, teach your future weathermen (or women) where, when, and how hurricanes occur. They identify hurricane regions and...
Curated OER
Shedding Light on the Weather with Relative Humidity
Learners study weather using a graphing calculator in this lesson plan. They collect data for temperature and relative humidity for every hour over a day from the newspaper, then place the data in their handheld calculator and examine it...
Curated OER
comparison of Two Gender Sports Teams
Students gather data on sports team and create a box and whisper plot. In this data collection instructional activity, students find the median, the quartile range, and relationships between variables.
Curated OER
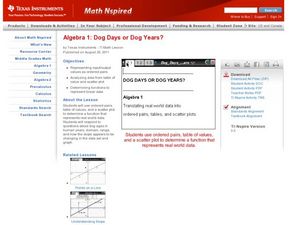
Dog Days or Dog Years?
In need of some algebraic fun with real world implications?Learners use ordered pairs, a table of values and a scatter plot to evaluate the validity of several real world data sets. The class focuses on dog ages in human years, domain,...
Curated OER
Take an Ant to Lunch
Second graders construct a model of an ant, exemplifying that ants are insects. Students gather data create a pictograph chart to show ant food preferences. Also, 2nd graders access the Internet to explore ant eating habits.
Curated OER
Winter-time Temps
Students measure temperature and become aware the the temperature above and below the snow is different. In this winter temperature lesson, students measure temperatures to find variation based on how the snow is packed. Students create...
Curated OER
Corn-Crop is a Bin-Buster
Learners calculate percent change and create lists of data. They enter the corresponding bushels of corn measured in billions to their list and display, then convert the acres into scientific notation and use the value on the home screen...
Curated OER
Scatter Plots
Seventh graders investigate how to make and set up a scatter plot. In this statistics lesson, 7th graders collect data and plot it. They analyze their data and discuss their results.
Texas Instruments
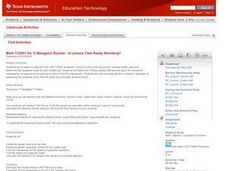
Math TODAY for TI-Navigator System - Is Leisure Time Really Shrinking?
High schoolers organize data from the USA TODAY Snapshot, "Is leisure time really shrinking?" into two scatter plots and determine the quadratic model for each scatter plot. They determine if these graphs intersect and learn the concept...
Curated OER
Discovering Mitosis in Onion Roots
High schoolers discover the different stages of mitosis by examining onion roots under a microscope, drawing diagrams of what they see, and organizing collected data in a chart and create a pie graph from their lab data.
Curated OER
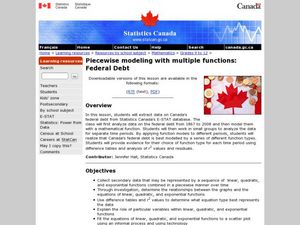
Piecewise Modeling with Multiple Functions: Federal Debt
Students analyze data on debt and write an equation. In this statistics lesson, students are given data from different time periods, and are asked to graph and analyze the data. They work in groups, and are assigned different parts of...
Curated OER
Boiling and Freezing Points of Water
Challenge your sixth graders with this lesson about the freezing and boiling points of water. In these activities learners graph temperature data, read and analyze information, and identify the freezing and boiling points of water and...
Curated OER
Comparing Pulse Rates
Young scholars participate in a lab that demonstrate one example of how the human body maintains homeostasis. Students collect data from themselves and observe how their own bodies react to exercise.
Curated OER
How Does Your Blue Bonnet Grow?
Learners explore the conditions needed to grow Texas Blue Bonnets. In this Blue Bonnet planting lesson, students recognize the differences in Texas Blue Bonnet. Learners record their findings in a graphs and analyze their results.
Statistics Education Web
Using Dice to Introduce Sampling Distributions
Investigate the meaning of a sample proportion using this hands-on activity. Scholars collect data and realize that the larger the sample size the more closely the data resembles a normal distribution. They compare the sample proportion...
Curated OER
Discovering Growth Patterns
Students explain the differences between linear (arithmetic) and exponential (geometric) growth. They use worksheets imbedded in this lesson to help them make predicitions and graph data points.
Curated OER
Herb is the Word
Students graph the data collected on seedling establishment and
survival for each soil type over a 6 week period. Each lab group graphs data
gathered from one plant. They choose a color for each soil type and create a key for the...
Statistics Education Web
I Always Feel Like Somebody's Watching Me
Future statisticians and potential psychics first conduct an experiment to collect data on whether a person can tell if someone is staring at them. Statistical methods, such as hypothesis testing, chi-square tests, binomial tests, and...
Curated OER
Temperature and Pressure
Middle schoolers conduct an experiment to determine the relationship between pressure and temperature. In this physical science lesson, students collect data and graph them. They compare the results of Celsius and Fahrenheit data sheets.
Curated OER
Pumpkin Play
Have you ever examined a pumpkin and estimated the number of lines it has? In this math lesson, students count the actual number of lines, record and graph the results. They investigate the circumference, weight and buoyancy of the...
Statistics Education Web
Double Stuffed?
True or false — Double Stuf Oreos always contain twice as much cream as regular Oreos. Scholars first measure the masses of the filling in regular Oreos and Double Stuf Oreos to generate a class set of data. They use hypothesis testing...
Howard County Schools
Exponential Decay Exploration
How can you model exponential decay? Explore different situations involving exponential decay functions and decreasing linear functions by performing activities with MandM candy, popcorn kernels, and number cubes.
Curated OER
Don't Lose Your Load!
Students create graphs using collected data. In this algebra lesson plan, students use spreadsheet in Excel to create graphs to interpret their data and make predictions. They rewrite word problems using algebraic expressions.


