Statistics Education Web
Sampling in Archaeology
Compare different random sampling types using an archaeological setting. Scholars collect data from an archaeological plot using simple random samples, stratified random samples, systematic random samples, and cluster random samples....
Curated OER
How Toxic Is It?
Students participate in an activity in which they investigate the scientific method and seed germination as well as practice graphing and metric measuring skills. Students examine toxicity by exposing Wisconsin Fast Plants seeds to toxic...
Curated OER
Water Quality in the Greenhills Stream
Seventh graders conduct year long study of water quality over different seasons using variety of probes, including D.O., pH, conductivity and temperature, that are attached to portable technology. Students select three data points in...
American Statistical Association
What is the Probability of “Pigging Out”
Learners apply their understanding of luck to a probability experiment. They play a game of Pass the Pigs to determine the probability of a specific outcome. Using analysis for their data, pupils declare the measures of center, dot...
Curated OER
High and Low Tides
Students collect real world data from the Web regarding high and low tides at various locations in the United States. They find a function which models this data and make predictions on tide levels based on the information found.
American Statistical Association
A Sweet Task
Candy is always an effective motivator! A fun math activity uses M&M's and Skittles to explore two-way frequency tables and conditional probability. The candy can serve a dual purpose as manipulatives and experimental data.
Curated OER
Ice Melting
Students design investigations to test various materials to prevent heat gain in frozen water. The task assess students' knowledge of scientific inquiry including the following skills: observation, data collection, measurement,...
Curated OER
Pendulums
Students construct a pendulums and experiment with what variables change or effect the rate at which they swing through an arc. They are assessed on scientific inquiry including the following skills: observation, data collection,...
Curated OER
Coin-a-copia: A Thanksgiving Glyph Activity
Students explore glyphs that are pictorial representations of data. Students collect and display data about themselves and a variety of other topics. Students practice using a legend to analyze and interpret data.
Curated OER
Observing Atherosclerosis
High schoolers develop a model to visually observe the change in blood flow rates between healthy and unhealthy arteries. They calculate data that they have collected and graph their results. They determine the relationships the flow...
Statistics Education Web
How Wet is the Earth?
Water, water, everywhere? Each pupil first uses an Internet program to select 50 random points on Earth to determine the proportion of its surface covered with water. The class then combines data to determine a more accurate estimate.
NASA
Newton Car
If a car gets heavier, it goes farther? By running an activity several times, teams experience Newton's Second Law of Motion. The teams vary the amount of weight they catapult off a wooden block car and record the distance the car...
Space Awareness
Greenhouse Effect
A greenhouse provides additional warmth and protection to the plants inside, but what if the greenhouse gets too hot? Pupils discuss and experiment with the difference between natural and anthropogenic greenhouse effect. They measure the...
Illustrative Mathematics
Paying the Rent
Learning how a bank account works is a useful tool. The exercise in the resource is to deduct rent from a checking account and create an equation from a description. Participants then graph the balance of the bank account versus months...
University of California
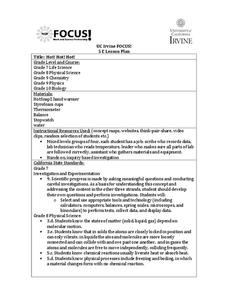
Hot! Hot! Hot!
Calories are not tiny creatures that sew your clothes tighter every night, but what are they? A science activity, presented at multiple levels, has learners experiment with heat, heat transfer, and graph the function over time. It also...
Curated OER
Solar Kit Lesson #11 - Power Maximum: An Electrical Determination
Collaborative groups connect resistors and solar panels in series and measure electrical resistance, voltage, and current. The objective is to order 16 solar panels from strongest to weakest. They graph current-voltage and power curves...
Virginia Department of Education
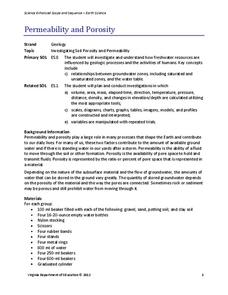
Permeability and Porosity
Covering both permeability and porosity, scholars perform a hands-on experiment testing various soil types. The material includes a pre-lesson worksheet to help focus pupils on the task at hand.
Curated OER
Graphosaurus
Students complete bar graphing activities with a dinosaur theme. Students discuss their favorite dinosaurs, collect data about the discussion, and make a floor graph of the information. Students complete a dinosaur graph worksheet.
Curated OER
Demography of Roosevelt Over Time
Students examine how the demographics of their high school have changed over time. After collecting and graphing data, they write their conclusions. They share their analysis with the class and compare them with others.
Curated OER
Evidence of Change Near the Arctic Circle
Students analyze graphs and make conclusions about climate change. In this climates lesson students produce graphs and identify relationships between parameters.
Curated OER
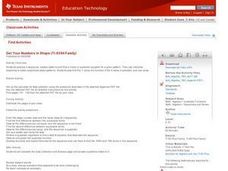
Get Your Numbers in Shape - TI-83
High Schoolers use the TI-83 calculator to produce a sequence, explore patterns and find a linear or quadratic equation for a given pattern. They use inductive reasoning to make conjectures about patterns. They find the Y-value of a...
Curated OER
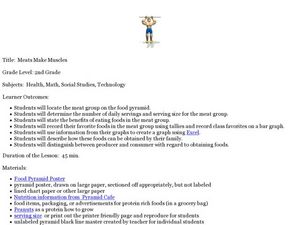
Meats Make Muscles
Second graders explore the meat group of the food pyramid. In this nutrition and diet lesson, 2nd graders study the benefits of eating foods in the meat group, collect data regarding their classmates' favorite foods, and create a graph...
Curated OER
How Do Plants Grow?
Students investigate plant growth. In this plant growth lesson, students investigate what would happen to plants if they did not have water and sunlight. Students conduct experiments to determine what plants need. Students create a...
Curated OER
El Nino Lesson
Students compare graphs of weather occurrences. In this environmental lesson plan, students will being using the website to gather weather related information for a certain time period. The students will then graph the data that will be...


