Curated OER
A Closer look at Oil and Energy Consumption
Upper graders analyze basic concepts about the consumption, importation and exportation of the worlds oil production. They create several graphs to organize the data and draw conclusions about the overall use of oil in the world.
Curated OER
Dental Detectives
First graders explore the theme of dental health and hygeine. They make tooth loss predictions, count lost teeth, and graph tooth loss. In addition, they listen to dental health stories, read online stories, create spreadsheets, and play...
Curated OER
TE Activity: A Tornado in My State?
Students study data about tornadoes in the United States while completing a worksheet. They develop a bar graph showing the number of tornadoes for the top ten states in the US. They find the median and mode of the data set.
Curated OER
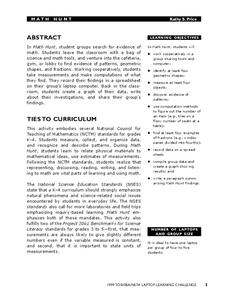
Math Hunt
Go on a scavenger hunt around your school to find evidence of math. Investigate different areas of your school for patterns, fractions, and different geometric shapes. Finally, create a spreadsheet and plot the data you've collected.
Curated OER
What Goes Up Must Come Down!!
Fifth graders look at actual sunrise and sunset times for their hometown to determine a pattern in the amount of daylight. They collect their data in Excel and create a chart to help them identify the pattern, then write an explanation...
Curated OER
Mathematics Module
Delve into graphing! The concepts covered begin with basic graphing basic coordinates and algebraic expressions on coordinate planes, and build up to graphing linear inequalities and equations. Learners solve and simplify various...
Curated OER
Vacation Values: A Math WebQuest
Fifth graders participate in a Math Web Quest to research two vacation options for their "families" in order to determine the best mathematical value for their family. They gather data, create two comparison graphs based on that data,...
Curated OER
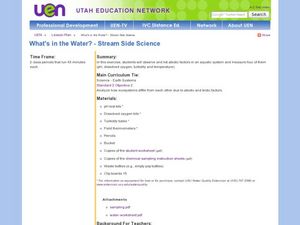
What's in the Water? - Stream Side Science
Here is a complete activity in which young biologists or ecologists test the pH, dissolved oxygen, turbidity and temperature of stream water. The class visits an actual stream and makes observations of the site. They use scientific...
Curated OER
Ball Bounce Experiment
Students investigate different balls' abilities to bounce. They conduct a Ball Bounce Height Comparison and Ball Bounce Time Comparison, complete a worksheet, graph the results of their experiment, and answer investigating questions.
Curated OER
Exploration of "Pillbugs"
Fifth graders define vocabulary terms, identify the characteristics of a pillbug, and create a dichotomous key. Then they examine the pillbugs and make observations and record these observations. Finally, 5th graders observe specific...
Curated OER
Feeling the Heat
Pupils record temperatures at different locations around campus. They examine the results and draw conclusions about how materials and colors affect the amount of heat produced. They also analyze Los Angeles' temperature records over a...
Virginia Department of Education
Average Atomic Masses
Facilitate learning by using small objects to teach the principles of atomic mass in your science class. Pupils determine the average mass of varying beans as they perform a series of competitive experiments. They gather data and...
Curated OER
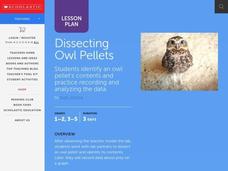
Dissecting Owl Pellets
Students watch the teacher model the dissection then in pairs, they dissect an owl pellet and identify its contents. They record the data about its prey on a graph.
Curated OER
How Many?
Middle schoolers explore and design ways to collect data through simulations and random samples. They perform two experiments to determine the answers to various probability problems, and present the data/graphs in the form of a...
Curated OER
How Tolerant Are Kids in Your School?
Students graph results of a survey about attitudes and tolerance in their school. They discuss the social climate of their school. Students complete a questionnaire, and tabulate the raw data from their class. They create a bar graph...
Curated OER
Color Burst
Fourth graders explore how colors react in water (chromatography) and other solvents. They observe, investigate, measure, record data and communicate their results in the form of graphs/charts and narration presented to the class....


