Curated OER
The Importance of Imports
Learners explore world trade by examining items they find at home and listing countries those items came from. Data is displayed on a map and charted according to continent. They discuss how products are transported.
Curated OER
Great Tasting Shapes
Fifth graders investigate the concept of median, mode, and range using a simple model for display purposes. They examine different shaped crackers out of a box and identify the ones that occur the most. Then the calculations for the...
Curated OER
Forensics 101
Students interpret how to communicate information and ideas in ways that are appropriate to the purpose and audience through spoken, written, and graphic means of expression. They use information-gathering techniques, analyze and...
Curated OER
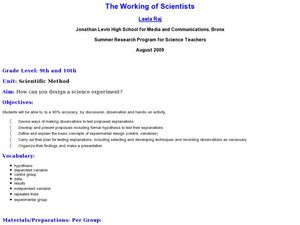
The Working of Scientists
Students define and explain the basic concepts of experimental design. In this scientific method instructional activity students complete a hands on activity, develop and present proposals to test their explanations.
Curated OER
The Beat of Your Heart
Students explore different applications involving their own heart. In this illumination instructional activity students measure their fists and relate it to the dimensions of their hearts.
Curated OER
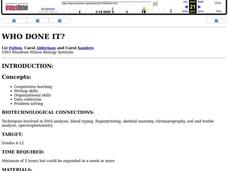
Who Done It?
Students work in groups to solve various murder mysteries using DNA evidence to implicate suspects. Teams compete to solve the crimes the fastest, while using various scientific methods to accomplish their task.
Curated OER
Skittle Graphing (Lesson Plan)
Students discuss the uses of graphs. They use color candies to count and sort before designing graphs. They label the graph papers with appropriate titles and candy colors. They complete the graph bars, and discuss the results with a...
Curated OER
Life in Streams and Ponds
Students collect microorganisms, demonstrate correct laboratory/Gram stain procedure, and design and construct tables to organize data.
Alabama Learning Exchange
Jelly Beans Add Up
Students explore counting, sorting, and graphing skills. In this data analysis lesson plan, students sort jelly beans by color, count the jelly beans, and create a bar graph of the jelly beans according to color.
Curated OER
Graphing Pasta
Students sort and graph various types of pasta. Using pasta construction paper patterns or real pasta, they sort the pasta by color, size, and type, and record the data on a graph.
Curated OER
Closing the Case
Fifth graders collect data and prepare data displays using a survey with statistical information.
Curated OER
Investigating the Probability
Students investigate probability using coins and dice. They collect data, graph, organize and interpret data. They predict, describe, compare, compute and draw conclusions based on what they observe and record.
Visa
Money Responsibility
Introduce young learners to the important life skill of responsibly managing money and recording how much they spend and save.
Curated OER
Climate Change
Students compare weather data and draw conclusions. In this climate change lesson plan, students determine whether data collected over a period of ninety years shows a warming trend.
Curated OER
Michigan Virtual Field Trip
Students analyze data from a virtual field trip to Michigan. They conduct Internet research on mileage and travel time between cities, calculate and compare fuel costs, and research and calculate lodging, activities, and meal costs.
Curated OER
Statistics with State Names
Students analyze the number of times each letter in the alphabet is used in the names of the states. In this statistics lesson, students create a stem and leaf plot, box and whisker plot and a histogram to analyze their data.
Curated OER
Bar Graphs
Young scholars perform operations and graph their data using charts and bar graphs. In this algebra lesson, students follow specific steps to make a bar graph. They create a survey about people favorite things and plot their data from...
Alabama Learning Exchange
Inch by Inch
Third graders listen to a read-aloud of Leo Lionni's, Inch by Inch before measuring a variety of items using both standard and metric units. They record the measurement data and follow a recipe for dirt pie.
Curated OER
What Would Make Our School More "Green"?
Students survey their school to get ideas for how to make the school more environmentally friendly. In this environmental lesson plan, students collect data from other students and teachers. They use the data to create graphs and present...
Curated OER
Reaction Time
Third graders review important vocabulary to explain measures of central tendency and reaction time. In pairs, they measure reaction time of dropping and catching a ruler. Data is collected after repeated catches and information is...
Curated OER
Reaction Time
Learners record reaction time data and calculate minimum, maximum, mean, median, and mode. They participate in a class reaction time activity, observe and conduct an online experiment, and discuss and analyze the activity results.
Curated OER
Mean Meadian and Mode
Students apply central tendencies to given data. In this statistics lesson, students calculate the mean, median, and mode as it relates to their data. They collect data and graph it while identifying the way the numbers are ordered.
Curated OER
Graphing Favorite Fruit
Third graders take poll and sort data, enter the data to create a spreadsheet and create bar and pie graphs.


