Curated OER
Super Spreadsheets
Learners develop a spreadsheet containing statistical data. They describe and interpret the data to make conclusions. They review the differences between an unorganized spreadsheet verses an organized one.
Curated OER
Probability With a Random Drawing
Young scholars define probability, and predict, record, and discuss outcomes from a random drawing, then identify most likely and least likely outcomes. They conduct a random drawing, record the data on a data chart, analyze the data,...
Curated OER
Graphing Fun In Third Grade
Third graders display information in a graph, table, and chart. In this data lesson plan, 3rd graders look at graphs, tables, and charts, discuss their importance, and make their own.
Curated OER
Watts Up Doc?
Students examine the wattage of a light bulb using math. In this algebra lesson, students find the inverse square of given parameter. They work in groups collecting and analyzing data.
Curated OER
Different! Diverse! Dynamic! Lesson 1: Late Bloomers
Young scholars examine how people grow and mature at different rates. They create a graph and a timeline to organize the data they collect.
Curated OER
Climate Watch
Pupils participate in a national survey of biological indicators of climate change by gathering and submitting data on local plants and animals.
Curated OER
Changing Ramp Heights
Learners conduct an experiment to determine how the change in ramp height affects the distances a ball is able to move a stationary cup. Data is collected from several trials and recorded and analyzed.
Curated OER
Community and Me
Students continue to examine the concept of communities. In groups, they identify and create a list of their needs and wants and create artwork showing their community working properly. They describe the differences in communities...
Curated OER
Investigating the Shapes of Covalent Molecules and Measuring their Respective Bond Lengths and Bond Angles
High schoolers will draw Lewis structures of common covalent compounds using a Chem 3D computer program. They will predict the shapes of the molecules, complete a data table, and formulate rules for predicting shapes of molecules. In the...
Curated OER
Energy Content of Foods
Learners collect data, organize and analyze the data and compare it to real life scenarios. This assignment requires two class periods.
Curated OER
Exploring Probability
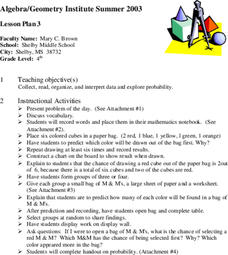
Fourth graders participate in a lesson that explores probability. They use candy and model cubes to experiment with different outcomes that can be charted if the students can proceed to the objective of the lesson. They discover how...
Curated OER
Making Money and Spreading the Flu!
Paper folding, flu spreading in a school, bacteria growth, and continuously compounded interest all provide excellent models to study exponential functions. This is a comprehensive resource that looks at many different aspects of these...
National Security Agency
Are You Ready to Call the Guinness Book of Records?
Learners design questions that can be answered by collecting data. In this line-plot lesson, pupils collect data and graph on a line plot on world records. An abundant supply of teacher support is provided in this resource.
Curated OER
Quarter, Nickel, Dime....
An engaging game called, "Quarter, Nickel, and Dime" is presented in this math lesson. Players are given an envelope with slips of paper that represent the three coins. In pairs, they play the game 18 times, and the whole class charts...
Curated OER
Puddles and Soil
Students determine which of several soil samples (sand, soil, and slit) produces puddles, providing insight into the permeability of these different soils. This task assesses students' abilities to make simple observations, collect,...
Curated OER
Statistics and Shopping
Learners explore the concept of using consumer data and statistics to aid in the consumer decision making process. For this consumer data and statistics lesson, students research consumer data and statistics. Learners analyze the data...
Curated OER
Keep It Cool
Pupils complete a science experiment to study insulation, heat transfer, and permafrost. In this permafrost study lesson, students design and test a soda insulator. Pupils graph their class data and discuss the results. Students discuss...
Curated OER
Changes in Pulse Rate
Eighth graders practice making observations and collecting data after determining a baseline pulse rate then collect data on the changes in that rate with exercise. Students must organize their data and analyze their observations.
Curated OER
Different Perspectives of Oregon's Forest Economic Geography
Students map data on employment in wood products manufacturing in Oregon counties. In this Oregon forest lesson, students discover the percentage of people employed in the forest manufacturing industry. Students create a box and whisker...
Curated OER
Identifying Creatures
Young scholars use a classification key from a provided worksheet to identify creatures. This task assesses student's abilities to interpret data, make decisions, identify, and classify.
Curated OER
Rolling Down Hill
Students perform an experiment, collect, and analyze data of a rolling marble down a ramp. They report results after they complete their experiment. Students are assessed in science and writing.
Curated OER
Internet Field Trip: Simple Machines
Learners observe and identify the types of simple machines. They conduct research and gather data to increase the comprehension of simple machines. Students identify and comprehend data to complete a graphic organizer and focus...
Curated OER
Tulip Graphing
Students create a graph of tulip growth. In this data analysis lesson, students plant tulip bulbs and use graph paper to begin graphing data on the growth of the tulip.
Curated OER
Bar Graphs
In this bar graphs worksheet, students, working with a partner, explore how to read and analyze the five answers to one mathematical bar graph.


