Curated OER
Getting to Know the Streets of Honolulu
Students practice identifying the streets names of Honolulu. Using a city map, they identify a main street and two intersecting streets. They research the origin of the name and complete a worksheet. They share their findings and...
Curated OER
Graphing
Fifth graders create graphs based on climate in South Carolina. They read and interpret information in a chart and construct a graphy from the information in the chart. They create a spreadsheet using Excel and publish 2 graphs.
Curated OER
Stem-and-Leaf Plots
Students are introduced to stem-and-leaf plots and calculating the mean, median, and mode from the plots.
Curated OER
Understanding Cloud Formation
Students explore air and clouds by watching demonstration. They perform an experiment to measure air pressure changes.
Curated OER
Understanding Cloud Formation
Students read and relate the poem, "Clouds" by Aileen Fisher to a demonstration on cloud formation. They create clouds in jars using ice water and matches then discuss the ways clouds can be used to predict weather.
Curated OER
Helping Hands: Promoting Gloval Awareness
Eleventh graders explore Canadian support for foreign aide. In groups, 11th graders discuss Canadian aide policies and express their opinion of each. Students brainstorm methods of contributing to developing nations. They complete...
Curated OER
Do You See What I See?
Pupils hypothesize the role of rocks, soil, and water by observing a terrarium and create a model to explore the water cycle. This is part of a five station set up.
Curated OER
We Are Having a Party! Part II
Second graders, in groups, participate in a four-station rotation model to solve problems. They use coins and dice for stations one, two, and three.
Curated OER
What Percentage of your Class is Right or Lef Handed?
Students using their right hands, put the first letter of their last name in each square on a piece of square grid paper. Then after the 20 seconds is up, they do the same thing using their left hands.
Curated OER
Cloud Observation and Graphing
Students identify the three major cloud groups. They are introduced to the three main cloud types and spend a week making and recording observations of clouds. Students produce a graph that presents their findings and conduct research...
Curated OER
So, just how hot am I?
Young scholars design a lab demonstrating the scientific method. In this earth science lesson, students investigate different materials for their heat absorbing property. They report their findings in class.
Curated OER
Pulse
Students determine a baseline pulse rate then chart the changes in rate with exercise. They describe the changes and develop a rationale for their observations. The task assesses students' abilities to make simple observations, determine...
Curated OER
People Interacting with the Environment
Students explore an arctic, temperate, and tropical environment and then decide what people need in each environment to help them live comfortably and what their lives would be like.
Curated OER
Butterfly Life Cycle
Third graders investigate the life cycle and development of butterflies. They complete an online WebQuest, and write journal entries about their research information. Students create a poster, and observe real Painted Lady larvae...
Curated OER
Recording Treasure
Students participate in a garage sale. They will weigh the items sold. They will calculate the total weight of items sold and donated to an agency.
Curated OER
Classification
Second graders sort insects into groups by determining similar characteristics. They role play as Entomologists to sort insects.
Curated OER
Presentation of Findings
Students compile and format their findings from the worm bins, the plant activity, and their Internet research on related topics into scrapbooks.
Curated OER
Insect Classification
Students compare and contrast the visible structures of three insects based on photographs. They differentiate characteristics of crane flies, ants, and wasps then create a simple classification system.
Curated OER
Making a Mountain Out of a Snow Hill: Skiing, Winter Sports, Economics, Business, Problem Solving
Students explore how to select among choices of variables and analyze the cost-benefit ratio of their short and long term planning in a team activity as they consider the planning and operation of a ski slope.
Curated OER
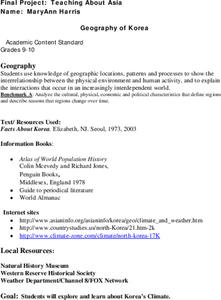
Geography of Korea
Students are introduced to the geography of Korea. Using the internet, they identify the weather and climate in the country and create a week weather chart for Korea's four seasons. They complete an interview with a local weatherman...
Curated OER
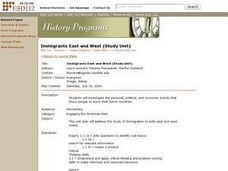
Immigrants East and West
Students investigate the personal, political and economic events that drove people to leave their home countries. They research Chinese migrations in the 1800s and the English migrations in the 1600s. They create an identity based on...
Curated OER
What's Your Favorite Stuffed Animal?
Second graders gather information in a survey and interpret the results using a tally chart, a table, and a bar graph. They' present their results of the during the final group discussion. The subject of the survey is favorite stuffed...


