Curated OER
Who Has the Data? Monitoring Coral Reefs
Young scholars access data to characterize coral reefs. In this scientific research lesson plan, students access data and explain the need for such data when monitoring coral reefs. They will identify and explain three major threats to...
Curated OER
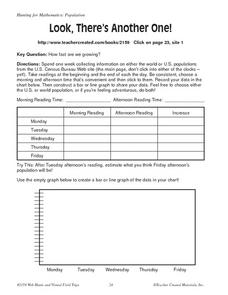
Look, There's Another One!
In this math worksheet, learners spend a week collecting information on either the word or U.S. populations from the U.S. Census Bureau Web site. Students record their data in a chart and bar graph. Learners also use the website to...
Curated OER
The Great Race
Students identify the mean, median and mode of collected data. In this statistics instructional activity, students collect, graph and analyze data using central tendencies. They work in groups to collect data on a robot through an...
Curated OER
Canada Data Map
Students collect data and analyze it. In this algebra lesson, students collect data on the population characteristic in different regions. They use population, culture, settlement and others to help in their criteria.
Curated OER
Graphing Data Brings Understanding
Students collect, graph and analyze data. In this statistics lesson, students use circle, pie, bar and lines to represent data. They analyze the data and make predictions bases on the scatter plots created.
Curated OER
Data-gathering Activities Relating to Trees in Their Environment
Students gather data relating to trees in their environment. In this biology lesson plan, students determine heights of trees and their ages. A canopy map will indicate optimal growing areas for the tree.
Curated OER
Weather Instrument Data Information
In this science worksheet, students are given the task of recording weather information twice daily using the homemade weather instruments.
Curated OER
Bar Graphs
Seventh graders visually represent and analyze data using a frequency table. They recognize what values in a data set are bigger by looking at a bar graph and answer questions about certain bar graphs and what they represent. Students...
Curated OER
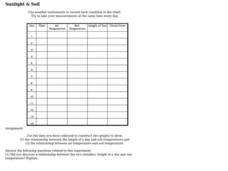
Sunlight & Soil
In this earth science worksheet on sunlight and soil, learners use data collected in a chart to construct two graphs. Following, they answer five questions as they relate to the experiment performed.
Mabry MS Blog
Scatter Plots
Scatter plots are a fun way to gather and collect relevant data. The presentation goes through several examples and then describes the different types of correlation.
abcteach
What is Your Favorite Month?
A simple worksheet that helps learners conduct a survey is here for you. In it, pupils collect data on their family and classmate's favorite months. Youngsters use tally marks in the spaces provided to keep track of the answers. Once...
Curated OER
What Are Your Favorite Apples?
In this tally worksheet, students take a survey to determine the favorite apple. They write tally marks beside the apple chosen. For elementary students, this worksheet may be used for counting purposes and to reinforce what a tally mark...
Curated OER
Sex Stereotypes in Society
Students analyze a collection of advertisements or photographs in a text or magazine and identify the stereotypes used or possible biases of the editors. They discuss how these stereotypes are formed, and the ways in which they impact...
Curated OER
What Does the Sun Give Us?
Pupils study the sun and how solar energy works. To learn about renewable energy, they complete a lab activity using a pizza box as a solar heater. Quite clever!
Curated OER
Jelly Bracelets: Fashion or Sex Game?
Ever-changing fashion fads are the ideal context for an engaging sociology experiment for adolescents. Through research and conducting a survey, learners draw conclusions about the controversial jelly bracelets fad, banned in some...
Curated OER
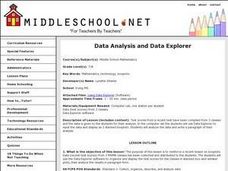
Data Analysis and Data Explorer
Students use the Data Explorer software to organize and display the test scores for the classes in stacked box-and-whisker plots, then analyze the results in paragraph form.
Curated OER
Fitting a Line to Data
Students work together in groups to collect data in relationship to how much water marbles can displace. After the experiment, they use the data to identify the linear equation to determine the best-fit line. They use the equation to...
Biology Corner
Pipe Cleaner Babies
Ever been told you have your father's eyes? How did it happen? Young biologists get a hands-on experience in meiotic gene expression with a fun pairs-based activity. Participants use pipe cleaner chromosomes with trait beads to make...
Curated OER
Graphing Data
First graders learn how to display data using a bar graph. In this bar graph lesson, 1st graders use data from a t-shirt color survey to make a bar graph. They also make an animal bar graph before interpreting the information.
Curated OER
Observing and Recording Biological Data
Learners create their own definition of life. They identify the eight characteristics of life in organisms. They compare and contrast the characteristics of living and nonliving things.
Curated OER
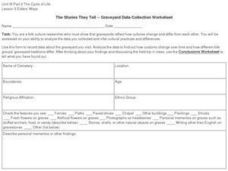
The Stories They Tell -- Graveyard Data Collection Worksheet
In this folk culture research worksheet, students use the form to record data about a graveyard that they visit to show that graveyards reflect how cultures change and differ from each other.
Curated OER
Spaghetti Graphs
Learners work in pairs to test the strength of spaghetti strands. They collect and graph data to determine a line of best fit. Students create a linear equation to interpret their data. Based on the data collected, learners predict...
Curated OER
Is Global Warming Happening?
Students investigate the probability of global warming and the effects of global warming on the environment. They conduct Internet research and collect data, transfer the data onto an Excel spreadsheet, and create a presentation that...
Curated OER
Cartesian Coordinates
Students investigate rational numbers through data analysis and statistics. In this algebra instructional activity, students represent, rename, compare and order rational numbers. They collect and represent data correctly on a graph.


