Radford University
Can I Create a Line/Curve of Best Fit to Model Water Drainage?
Learners collect data on the amount of water left in a bottle over time. They graph the data to determine whether the scatter plot shows a curved or straight relationship. Group members then determine an equation for the curve of best...
Las Cumbres Observatory
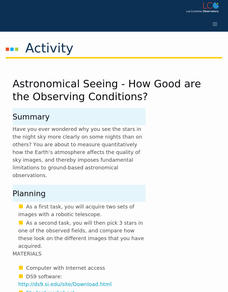
Astronomical Seeing - How Good Are the Observing Conditions?
Why is star gazing easy on some nights and difficult on others? Pupils aim to quantify the answer in an enlightening astronomy lesson. After collecting images from an online robotic telescope, they measure the brightness of images using...
Cornell University
Mechanical Properties of Gummy Worms
Learners won't have to squirm when asked the facts after completing an intriguing lab investigation! Hook young scholars on science by challenging them to verify Hooke's Law using a gummy worm. Measuring the length of the worm as they...
Curated OER
Lesson: Culture & Change
Can a palace door be art? Can it facilitate an understanding of people and places? It certainly can! Using a palace facade as a lesson catalyst, kids will discuss geometric patterns, the kingdom of Swat, and geopolitical themes. They...
Kenan Fellows
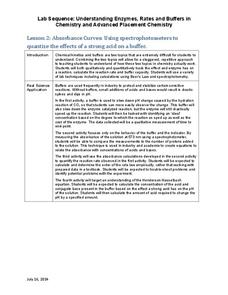
Absorbance Curves: Using Spectrophotometers to Quantize the Effects of a Strong Acid on a Buffer
The Henderson-Hasselbalch equation combined logarithmic terms with the application of carbonic acid as a buffer solution. Scholars learn investigate equation and its applications through hands-on experiments. They collect data and...
Smithsonian Institution
Trait Tracker
Help mice beat the odds with an exciting activity about traits. Biologists discover the role of diet and other factors on animal traits by participating in a simulation activity. Teams collect and evaluate data to understand how certain...
Baylor College
Body Strength
Your young learners will discover how muscular strength and endurance can increase with this truly hands-on activity! Beginning by writing an acrostic for the word strength, class members then engage in tracking their ability to squeeze...
National Park Service
Pulley Systems Used at Fort McHenry
What a great opportunity to integrate science into your lesson on the War of 1812! Discover how pulley systems were used to move 1,000 lb. cannons at the Battle of Fort McHenry, and to raise the flag that would inspire Francis Scott Key...
Baylor College
Energy for Life (Energy from Food)
Energy comes in many forms, but how do living things get the energy they need to survive and thrive? In a simple, controlled experiment with yeast, water, and sugar, groups make observations about how yeast reacts with water alone, then...
Howard County Schools
Planning for Prom
Make the most of your prom—with math! Pupils write and use a quadratic model to determine the optimal price of prom tickets. After determining the costs associated with the event, learners use a graph to analyze the break even point(s).
Captain Planet Foundation
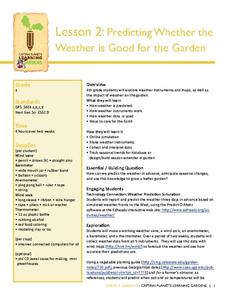
Predicting Whether the Weather is Good for the Garden
Can your class predict the weather? Show them how they can come close with a lesson about creating weather instruments, including weather vanes, barometers, wind socks, anemometers, and thermometers. Kids research weather patterns and...
Curated OER
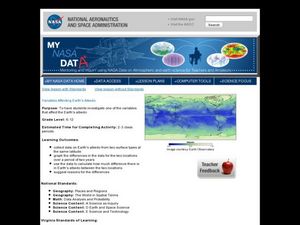
Variables Affecting Earth's Albedo
Students study the variables that affect the Earth's albedo. In this environmental data analysis lesson plan students interpret and graph information and calculate changes.
Montana State University
What's the Weather?
How many jackets do you need to stay warm and climb Mount Everest? An informatie resource covers the topic of Mount Everest, the resource helps young scientists discover the difference between climate and weather. Activities include...
Curated OER
Ghostbusting in the Chesapeake
Ghost pots, fishing gear lost during crabbing expeditions, continue to trap crabs that are never collected. Increase your budding ecologists' awareness of human impact on the environment as well as conservation efforts using this...
Scholastic
Study Jams! Scientific Theory & Evidence
Introduce someday scientists to ideas and explanations about how the world around us works by showing this cute cartoon. In it, Mia and Sam discuss what scientific theory is, and how it is important in discovering scientific laws making...
Rockefeller Archive Center
Understanding Mass Media News
In an age of fake news and photoshopped images, it is vital that 21st century learners development the skills they need to evaluate mass media and assess its validity. A great way to launch such a study is with a carefully crafted lesson...
Curated OER
Great Graphing
Students collect data, use a computer spreadsheet program to create various graphs, and compare the graphs. They state the findings of each graph in writing and decide which graph type best represents the data.
Curated OER
Lessons for Atlatl Users with Some Experience-Grade 6
Sixth graders experiment with an atlatl and dart. In this sixth grade data management mathematics instructional activity, 6th graders explore and determine the most suitable methods of displaying data collected from their...
Curated OER
Beverage Tests
Learners investigate the pH of a liquid. In this middle school mathematics/science lesson, students collect and analyze data regarding the pH of various liquids. Learners display their data in various types of graphs as they consider...
Alabama Learning Exchange
Keep It Movin'!
Learners conduct an experiment to study friction. They complete a KWL chart on friction and conduct an activity about the amount of friction on a moving object. To conclude, pupils create a table or graph of the data collected and they...
Curated OER
Beach Cleanup at a Local Beach
Students participate in an environmental clean-up activity. In this environmental lesson, students travel to a local beach. Working in small teams, students collect trash from the local beach. Returning to school, students sort the trash...
Curated OER
Monk Seal Research Expedition
Students study data. In this seal research lesson, students act as scientific researchers observing Monk seals in their habitat. They work in small groups to record data from a video and when through they share a piece of information...
Curated OER
Pizza, Pizza
Learners survey community members to determine their favorite pizza toppings and create a bar graph to show their findings. In this probability and statistics lesson, students collect data by conducting a survey. They analyze the data,...
Curated OER
The Effect of Acid Rain on Limestone
Pupils investigate the pH of rain water in this earth science lesson. They collect rain water from their area and explore the pH when lime stone is added, then they will use the data collected to conjecture as to the effect of acid rain...


