Curated OER
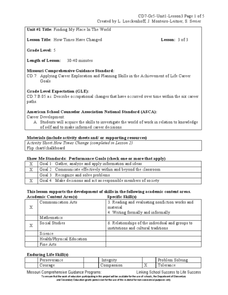
How Times Have Changed
Fifth graders work in small groups to compile job changes. They use data from the list of changes that the group generated together. Students analyze the data to determine: categories of changes, patterns or trends of changes, and future...
Curated OER
Slash Trash! Reducing, Reusing and Recycling Our Way to Zero Waste
The other "Three Rs" are covered in this lesson: reduce, reuse, and recycle. Over four weeks, conservationists collect data about waste in their own homes. They combine their findings with those of other students in order to analyze...
National Wildlife Federation
I’ve Got the POWER! Solar Energy Potential at Your School
Should every school have solar panels? The 19th lesson in a series of 21 has scholars research the feasibility of using solar panels at their school. They begin by gathering data on the solar energy in the area before estimating the...
Foundation for Water & Energy Education
How is Flowing Water an Energy Source? Activity A
Here is a fun little exploration of the potential energy potential of falling water. Learners drop water from various heights using a straw, and they analyze the diameter of the splash. Pair this with two more activities of the same...
Curated OER
Lesson 9: Tracking Commodities
Over the corse of a month, small groups will monitor the price of a specific energy commodity and analyze it in relation to global and domestic events. They play a trade simulation game and create infographics showing what they've...
Curated OER
Ranging the Triple M's
Fifth graders explore collecting and analyzing data. In this mean, median and mode lesson, 5th graders use real word data to determine the mean, median and mode. Students are given sets of numbers on index cards as asked to find the...
Curated OER
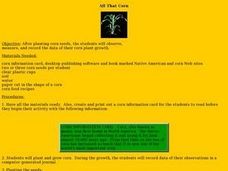
All That Corn
Students observe and record data. In this plant growth lesson, students plant and grow corn. Students observe the growth of their corn and record their data. Students read corn recipes and select their favorite four recipes to write...
Curated OER
The Appearance of a Graph
Sixth graders understand that the appearance and increment used on the x and y axis in a graph change how it looks. In this graphing lesson, 6th graders work in pairs and interpret graphs using different axes. Students collect graphs...
Curated OER
It's In The Chocolate Chips
Students investigate which brand of chocolate chip cookies contains the most chocolate. They analyze and compare data using Microsoft Word and Microsoft Excel. They communicate the results with Microsoft PowerPoint.
Texas Instruments
Light and Day
Pupils explore the concept of collecting data as they collect data on their graphing calculator about time, temperature, and light. Learners plot the data and create histograms and box and whisker plots to analyze the data.
Curated OER
What's The Teacher's Choice?
Fifth graders explore how to use data and display it using a chart or graph. They use food choices for categories and then gather the data and use the provided chart for display. In small groups students discuss the data and the results.
Curated OER
Virtual Field Trip: Lesson Ten - Publishing
Class members publish a letter describing their Virtual Field Trip incorporating data from previously developed charts, graphs, and data tables. The final lesson in a series devoted to collecting information and publishing data.
Rochester Institue of Technology
Ergonomic Packing
Pupils revisit the concepts of ergonomics and order picking examined in previous lesson plan and use the results of a simulation to brainstorm ergonomic designs for medical supply stations.
Curated OER
Weather instruments
Students explore weather instruments. In this weather lesson, students make rain gauges, anemometers, and barometers following the instructions given in the lesson. Students set up a weather station using their instruments and record and...
University of Georgia
Splat!
What does viscosity have to do with splatter? An activity shows that the viscosity of a substance is inversely proportional to the distance of its splatter. Learners conduct the experiment by collecting data, graphing, and analyzing the...
American Statistical Association
Speedster
Catch me if you can. Scholars collect data on reaction time by catching a falling ruler or by using an Internet app. They determine the median of the data, create graphs, and analyze the results. They also compare their data to the rest...
Curated OER
Seeds in Fall...Collect Them All!
Classify seeds by attributes such as size, shape and color! Learners classify seeds using a dichotomous key. They identify human behaviors that have a positive impact on preserving seed and plant biodiversity.
Curated OER
From Curiosity Cabinet to Museum Collection
Learners study binomial nomenclature and museum-based research. They create a curiosity box, label the objects in their curiosity box , develop a classification scheme for the objects, and create a database of all objects collected by...
Curated OER
Coral Snapshots
Using photographs and a coral reef identification key, junior marine biologists compare changes in coral cover for a No-Take Area and the surrounding unprotected area. The data that is collected is then analyzed for richness,...
EngageNY
Graphs of Exponential Functions
What does an exponential pattern look like in real life? After viewing a video of the population growth of bacteria, learners use the real-life scenario to collect data and graph the result. Their conclusion should be a new type of graph...
American Statistical Association
The Taste of Yellow
Does lemonade taste better when yellow? A tasty experiment has scholars determine the answer to the question. It requires conducting a taste test with lemonades of different colors (from food coloring), and then collecting and analyzing...
National Wildlife Federation
Who Can Live Here?
Not all species can survive in all habitats. Using specific criteria, learners assess the fitness of a local habitat to a specific species. They collect data and suggest enhancements to create a suitable habitat for their chosen species.
American Statistical Association
Spinners at the School Carnival (Equal Sections)
Spin to win a toy car. A fun activity has pupils use a spinner in which three of the equal sections represent winning a toy car, and the fourth section represents no car. They record the number of wins after certain numbers of spins,...
WindWise Education
Which Blades Are Best?
If I change the length, will they work better? After brainstorming the variables of wind turbine blade design, groups choose one variable to isolate and test. The groups then present their data to the class in order for all to have the...


