Curated OER
Sorting Plastics For Recycling
First, young chemists practice polymer identification by density and flame tests. With the data collected, they propose a method of separating polyethylene from other plastics and determine what property makes it desirable for recycling....
Curated OER
Determining Mean, Range, Median, Mode, and Probability
Students calculate mean, median, range, mode and probability. Then, working in teams, they use data from their workplace to compute values for these terms. Finally the class explores the term "probability" using a die.
Curated OER
Weather Tools of the Trade
Fourth graders study the basic meteorological instruments (thermometer, barometer, weather vane, anemometer, and rain gauge). They explore how they are used, data that can be collected from them, and why records of the data are kept.
Curated OER
A Wet Welcome Home
Students investigate data collection and analysis. In this Algebra I lesson plan, students create a scatter plot and find the equation of best fit in a simulation of a leaking water pipe.
Curated OER
The Air Up There
In this data collection and analysis activity, learners observe and graph the weather conditions during one school week, then calculate the average weather temperature. Extensions are included.
Curated OER
Our Desert Backyard
Students make observations of their own backyard. In this environment lesson, students keep records of the plants and animals they see in their home or school yard. Students make notes of how the weather and environment changes over...
Curated OER
Download and Analyze
Students download information from a NASA website into a database. They transfer it to a spreadsheet by completing the information and analyze the information. They determine temperature averages, mode, and graph the results. They write...
Curated OER
The Internet Pizza Server - Creating Your Own Pizza
Students create their own pizza, "order" it from the Internet, and see digitized versions. They calculate the area of various size pizzas in order to do cost analysis to determine best buys.
Curated OER
Graph It with Coffee!
Young scholars interview employers and employees at local coffee shops about sales and profits and create graphs comparing and contrasting information obtained about the businesses.
Curated OER
Dripping Wet or Dry as a Bone?
Students use a sponge and water model to explore the concept of relative humidity and create a percent scale. They define humidity and saturation, build a simple humidity/saturation model, collect, predict and interpret data, and create...
Curated OER
How Trees Contribute to the Water Cycle
In this water cycle instructional activity, 3rd graders conduct an experiment where they observe and calculate how water transpires in different types of trees. Students engage in a class discussion and use Venn Diagrams to compare...
Curated OER
Meet Your Partners
Students become student scientists and work with Internet partners to collect, share, and analyze data needed to draw conclusions about the Waipi'o Valley Stream Restoration.
Curated OER
Leonardo da Vinci
Middle schoolers select appropriate tools and technology to perform tests, collect data, and display data. They construct appropriate graphs from data and develop qualitative statements about the relationships between variables.
Curated OER
Animal Science Research Report
Students research an animal. In this research lesson, students utilize various types of technology to gather information about an animal. Students create a class blog and use digital photography for their research.
Curated OER
Meet the Weather Scientist
Fourth graders collect, record and analyze data using simple weather instruments or use weather resources to comprehend weather. They comprehend that scientists are very important people in today's world. Pupils look at cloud types to...
Curated OER
Weather: Piecing It All Together
Fourth graders collect, record, and analyze data using simple weather instruments and a variety of weather resources to investigate weather. They observe the teacher demonstrate how a rain gauge functions, record the weather for five...
Curated OER
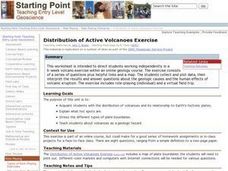
Distribution of Active Volcanoes Exercise
Students collect and plot data, then interpret the results and answer questions about the geologic causes and the human effects of volcanic eruption. They participate in a role-play activity and a virtual field trip, as well.
Curated OER
A Taste of Our Classroom
Students explore their classroom tastes. In this lesson plan, students list the four tastes that the tongue can detect, map the individual areas of taste on the tongue, and demonstrate the ability to identify objects through the use of...
Curated OER
What's Your Favorite Season?
Pupils collect data on the favorite seasons. In this data collection and analysis lesson, students learn about displaying data on charts and graphs. They collect data about the favorite seasons of the children in their class and display...
Curated OER
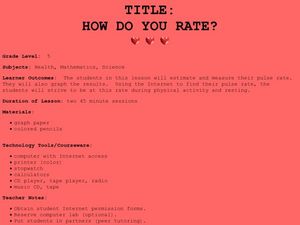
How Do You Rate?
Fifth graders make a graph. In this pulse rate lesson, 5th graders estimate their pulse and record it. Students measure their pulse while at rest and after physical activity and record it. Students use the internet to graph their results...
Curated OER
Activity Plan 5-6: What's In a Name?
Students use family names to gather and analyze data. For this counting lesson, students use graph paper to help organize their data and then, in a staircase fashion, organize the names from longest to shortest so they can answer...
Curated OER
String Of Lights
Learners collect, graph and analyze data. In this statistics lesson, students compare data using different types of graphs. They make predictions, draw conjectures as they analyze bulbs used in a holiday light set.
Curated OER
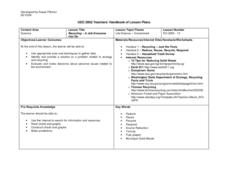
Recycling - A Job Everyone Can Do
Young scholars research recycling effort that take place in the US. They play an online game and complete handouts using Internet research.
Curated OER
This is the Way We Go To School
Second graders create and utilize a graph using the Excel computer program. They gather data regarding how the students get to school, tally the numbers for the class, and create a bar graph on paper and using Excel.


