Curated OER
Ice Cream Lab
I scream, you scream, we all scream for ice cream! Even high schoolers enjoy making ice cream. This laboratory exercise has them record the temperature changes throughout the process of liquid becoming solid, graph the results, and...
Curated OER
El Nino Lesson
Students compare graphs of weather occurrences. In this environmental lesson plan, students will being using the website to gather weather related information for a certain time period. The students will then graph the data that will be...
Curated OER
How Caves Are Formed
Young scholars explore caves. In this cave formation lesson, students take a virtual tour of a cave and then participate in a scientific investigation that requires them to grow crystals and chart data regarding their growth.
Curated OER
Processing Satellite Images
Learners comprehend the meaning of "pixel." They recognize patterns using pixels. Students observe how land use can be determined from a pixel. They measure off a 30 x 30-meter area to show the size of the surface area of one pixel....
Curated OER
Blast the Fats
Students examine the fats found in foods. In this nutrition lesson, students identify the types and amounts of fats found in foods as they research food labels and the Internet. Students classify the fats and record their data.
Curated OER
Coming to America: U.S. Immigration
Analyze primary source documents relating the conditions under with prompted American immigration. Learners will analyze information in order to create a six-panel pamphlet. Much of the lesson is not available but the key objectives are....
Curated OER
The Global Precipitation Measurement Mission (GPM) Lesson
Introduce your class to one of the ways that technology is benefiting humanity. The Global Precipitation Measurement Mission involves the data collected by nine satellites from different countries with a united focus on studying world...
Curated OER
Who Done It?
Pick and choose which activities to include in this crime scene investigation. Junior detectives can examine fingerprints, DNA, blood samples, or bone structure. The plan suggests you have teams solve a mystery, but it does not give you...
Curated OER
1900 America: Primary Sources and Epic Poetry
Using Walt Whitman's Song of Myself and Hart Crane's The Bridge as models, class groups first craft their own epic poems for 1900 and, using primary sources, create a multi-media presentation that captures the sights and sounds of life...
Curated OER
Finding and Collecting in the Field
Students examine the types of plants brought over to America from immigrants. They research how some of these types of plants cause damage and alter the landscape. They record data and share the information with the community.
Curated OER
WorldWatcher Activity: Using Data to Investigate Issues and Solutions
Students use the WorldWatcher program to identify the issues affecting their country they have been using for these activities. In groups, they identify each issue and identify the solution or develop their own. They present their...
Code.org
The Cost of "Free"
Explore the trade-offs of using a free app. The fourth installment of a 12-part unit helps young consumers discover the cost of receiving a free service. They learn how these apps make use of their access to data.
Statistics Education Web
Double Stuffed?
True or false — Double Stuf Oreos always contain twice as much cream as regular Oreos. Scholars first measure the masses of the filling in regular Oreos and Double Stuf Oreos to generate a class set of data. They use hypothesis testing...
Nuffield Foundation
Monitoring Water Pollution with Invertebrate Indicator Species
Healthy invertebrates mean healthy ponds. An outdoor activity has scholars collect samples of invertebrates from local lakes or ponds. They identify and count different species and use the information to estimate the level of pollution...
Virginia Department of Education
Heat Loss from a Fur-Insulated Animal
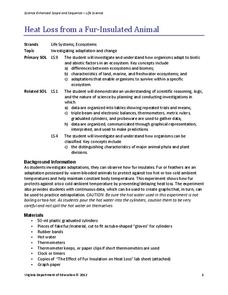
How do animals adapt to weather changes? Provide your class with the ability to understand adaptations and body temperature as they participate in this hands on experiment, using fake fur and hot water. Pupils collect data and analyze...
Curated OER
A Closer look at Oil and Energy Consumption
Upper graders analyze basic concepts about the consumption, importation and exportation of the worlds oil production. They create several graphs to organize the data and draw conclusions about the overall use of oil in the world.
Curated OER
Math in the Wetlands Field Trip
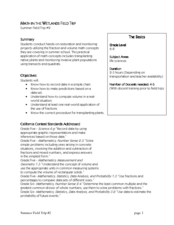
Get your class out in the environment for hands on math activities. In this wetlands lesson, learners transplant native plants, calculate how much soil is needed, and perform math activities based on this experience. They then make...
University of Colorado
Happy Landings: A Splash or a Splat?
Huygens spacecraft landed on Saturn's moon Titan in 2005, making it the farthest landing from Earth ever made by a spacecraft. In this hands-on activity, the 12th installment of 22, groups explore how density affects speed. To do this,...
Curated OER
Galaxy Hunter - A Cosmic Photo Safari
Space science stars journey through our night sky and take virtual photos of galaxies to investigate simple random samples. Higher math is used to analyze the data collected. Copy the evaluation/assessment questions onto a handout for...
Curated OER
Questioning NASA
Space science and math collide in this inquiry that investigates launching times for antacid-tablet rockets! Upper elementary or middle school learners collect data as they launch these mini rockets. They apply concepts of place value...
American Statistical Association
What is the Probability of “Pigging Out”
Learners apply their understanding of luck to a probability experiment. They play a game of Pass the Pigs to determine the probability of a specific outcome. Using analysis for their data, pupils declare the measures of center, dot...
EngageNY
Ruling Out Chance (part 1)
What are the chances? Teach your classes to answer this question using mathematics. The first part of a three-day lesson on determining significance differences in experimental data prompts learners to analyze the data by determining the...
University of Georgia
Heating and Cooling of Land Forms
Compare heating and cooling rates of different land forms. A lab activity has groups collect data on the rate of heating and cooling of soil, grass, saltwater, fresh water, and sand. An analysis of the rates shows how the different land...
Curated OER
Chemical Resistance and Synthetic Polymers
Students participate in lab activities in which they examine immersion, stain resistance, and stress cracking of synthetic polymers. Students use their collected data to discuss service applications and possible performance of materials.


