Curated OER
Eat Your Veggies
Students investigate displaying data. In this displaying data lesson, students use tallies to count data about food preferences. Students use various types of graphs such as bar graphs, picture graphs, box-and-whisker plots, etc to...
Curated OER
M & M Madness
Students work with the mathematics unit of collection, organization, and presentation of data. In this math and technology lesson plan, students use Valentine M & M’s and The Graph Club to sort and graph the various colored M & M’s.
Curated OER
The People of Kansas: Where did they come from and why did they come?
Students review census data to correlate to emigration in Kansas. In this Westward Expansion instructional activity, students analyze a painting and create definitions for emigration and discuss why people emigrate. Students read and...
Curated OER
Asthma Survey
Learners collect survey data on the prevalence of asthma in a community. They summarize and display the survey data in ways that show meaning.
Curated OER
You're the Scientist
Students explore ways to assess the accuracy and reliability of data reported by Journey North observers.
Curated OER
How to Graph in Excel
Fourth graders construct data graphs on the Microsoft Excel program. In this statistics instructional activity, 4th graders formulate questions and collect data. Students represent their results by using Excel.
Curated OER
When the Snow is as High as an Elephant
High schoolers study the concept of mean values using a data plot. Learners enter the given data in the activity to create their data table. They use the data table to calculate the mean of the snowfall percentage provided in the...
Science 4 Inquiry
At the Top: A Bald Eagle's Diet
Bald eagles are opportunistic predators and eat fish as well as raccoons and other mammals. Pupils learn about bald eagle diets through a simple simulation and videos. They collect and analyze data to understand the adaptability of this...
Statistics Education Web
Which Hand Rules?
Reaction rates vary between your dominant and nondominant hand ... or do they? Young scholars conduct an experiment collecting data to answer just that. After collecting data, they calculate the p-value to determine if the difference is...
Kenan Fellows
Density
Most scholars associate density with floating, but how do scientists determine the exact density of an unknown liquid? The third lesson in a seven-part series challenges scholars to find the mass and volume of two unknown liquids. Each...
Teach Engineering
Energy on a Roller Coaster
Roll with your class into the idea of conservation of energy. Pupils use a roller coaster track to collect data to reinforce the concept of conservation of energy and the influence of friction. Class members then create a graph from...
Curated OER
Analyzing Tree Rings to Determine Climate Change
Students examine how to locate and access data sets. In this climate change instructional activity students import data into Excel and graph it.
Curated OER
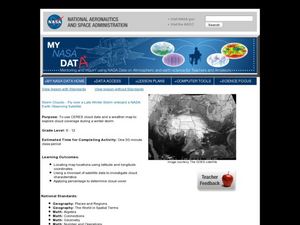
Storm Clouds-- Fly over a Late Winter Storm onboard a NASA Earth Observing Satellite
Students study cloud data and weather maps to explore cloud activity. In this cloud data lesson students locate latitude and longitude coordinates and determine cloud cover percentages.
Curated OER
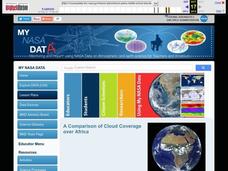
A Comparison of Cloud Coverage over Africa
Young scholars identify different climate regions and local weather patterns. For this cloud coverage lesson students use NASA satellite data and import it into Excel.
Curated OER
Data Analysis Worksheet
In this probability worksheet, 11th graders solve problems using simple random sample, cluster sample, bias, population and systematic sample. They match the questions to its definition.
Teach Engineering
Earthquakes Living Lab: Finding Epicenters and Measuring Magnitudes
Pairs use an online simulation to determine the epicenter and magnitude of an earthquake. Using real data about the earthquake's maximum S wave amplitudes, they then determine the magnitude. The resource provides a great career...
Virginia Department of Education
Quadratic Curve of Best Fit
Class members create a table of the number of chords that can be drawn given the number of points on a circle. Pupils analyze the data created, find a function to fit to it, and use the function to make further predictions.
National Council of Teachers of Mathematics
National Debt and Wars
Take a functional approach to the national debt. Learners collect information about the national debt by decade and plot the data. They determine whether an exponential curve is a good fit for the data by comparing the percent changes...
EngageNY
Relationships Between Two Numerical Variables
Is there another way to view whether the data is linear or not? Class members work alone and in pairs to create scatter plots in order to determine whether there is a linear pattern or not. The exit ticket provides a quick way to...
Teach Engineering
Preconditioning Balloons: Viscoelastic Biomedical Experiments
What does stretching a balloon have to do with equilibrium? Groups explore preconditioning by stretching a balloon to a point of equilibrium. They then measure the amount of force required to stretch the balloon to the same point several...
Teach Engineering
Where Are the Plastics Near Me? (Field Trip)
With a piece of plastic here and a piece of plastic there, here a piece, there a piece, everywhere a piece. Teams go on a field trip in order to document the locations and kinds of plastic trash in an area near them. The eighth...
Laboratory for Atmospheric and Space Physics
The Planets and Scale
Scholars gain an insight into the relative size of planets and distance between inner and outer planets with the help of informational text, a data table, and a series of four questions.
Alabama Learning Exchange
How Old is Your Money?
Elementary learners explore coin mint dates. First, they listen to the book Alexander Who Used to be Rich Last Sunday by Judith Viorst. They then sort a collection of coins according to their mint date and put them in order from oldest...
California Education Partners
Science Fair Project
Plant the data firmly on the graph. Given information about the growth rate of plants, pupils determine the heights at specific times and graph the data. Using the information, scholars determine whether a statement is true and support...


