Curated OER
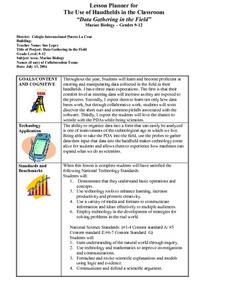
??Data Gathering in the Field??
High schoolers demonstrate that they understand basic operations and concpets, students further use technology to enhance learning, increase productivity and and promote their creativity. High schoolers gain an understanding of the...
Curated OER
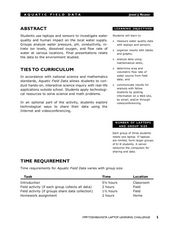
Aquatic Field Data
Students use laptops and sensors to measure water quality and graph their results. In this aquatics lesson students post their results to a website or email.
Curated OER
How Much Data is That?
Students differentiate between exponential and logarithmic functions. In this algebra lesson, students use logarithmic properties to solve equations. They identify growth and decay of graphs.
Curated OER
"Hard" Data from Space
Students use satellite images to analyze development patterns within Baltimore City. They prepare a land cover map for Baltimore indicating the prevalence of impervious surfaces and explore how these patterns affect water pollution.
Curated OER
Exploring Linear Equations And Scatter Plots - Chapter 5 Review
Young scholars complete rolling stocks experiment, and collect and enter data on the computer. They enter data on graphing calculators, complete scatter plot by hand with line of best fit, and discuss different graphing methods.
Curated OER
Make a Pass at Me
Students identify different types of functions and units of measurements. In this statistics lesson, students will collect data, graph their data and make predictions about their data. They plot a linear regression graph.
Curated OER
The World Population: Logistic Model
Learners explore the various uses of the logistic function. Students use the internet to collect world population data and find a logistic model for their data and use their chosen model to predict future populations.
Curated OER
Investigating Factors That Affect Rate of Enzyme Action
Students explore the properties of enzymes. In this chemical reaction lesson, students explore enzymes through a Web-quest and investigative study. Students will collect and summarize data and create a class presentation. This lesson is...
Curated OER
Model and Solve Algebraic Equations
Examine multiple ways to solve algebraic equations. Pupils will generate a problem solving strategy that addresses the prompt given by the teacher. They will then share their problem solving strategy with the class. Graphic organizers,...
Curated OER
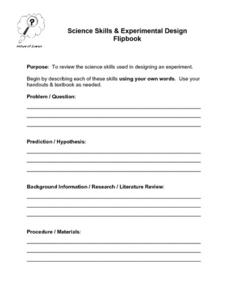
Science Skills and Experimental Design
In this experimental design worksheet, students describe the different science skills required when designing an experiment. Then students create a flipbook with the information. This worksheet has 9 short answer questions.
Curated OER
America's Underwater Treasures Viewing Guide
Students complete a worksheet while watching a video about how humans affect the ocean environment. They discover the need for a practice of balancing fisheries and their fishing practices. They examine how scientists use data to help...
Curated OER
Buzzing is BEE-lieving
Students investigate insects. In this insect lesson, students explore various insect models and identify the characteristics of each. Students observe insects outside and tally how many insects they observe.
Curated OER
Observe a Tree
Tiny tree-huggers observe and examine various species of trees around campus. They use My First Field Guide to Trees to support their observations. Different tree projects are offered that can include using natural materials to make a...
Curated OER
Weather With a Latitude
Young scholars read the temperature from a thermometer. In this weather lesson, students read a thermometer and record the temperature at twenty minute intervals. Young scholars discuss results.
Texas Instruments
Can You Breathe Like a Pinniped?
Young learners compare the breathing patterns of different animals in this pinniped lesson. They examine the breathing pattern of California sea lions and northern elephant seals. Pupils collect, compare and analyze data concerning...
Curated OER
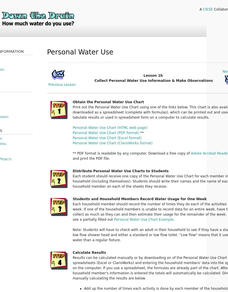
Down the Drain: How Much Water Do You Use?
Participate in an Internet-based project to share information about water usage with other students. Collect information about water usage and compare it to the average used by people in other parts of the world.
Curated OER
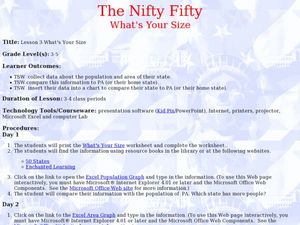
The Nifty Fifty-What's Your Size?
Learners explore state populations. In this state geography lesson, students use a variety of technology tools to research and graph population and area of assigned states.
Curated OER
Graphs Abound
Young scholars create a survey for their classmates to collect data on their favorite foods, eye color, pets or other categorical data. They compile the data from the survey in a table and then make a bar graph of each category using a...
Curated OER
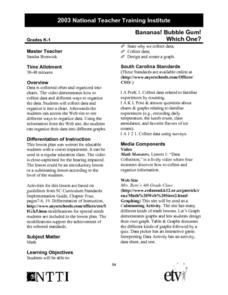
Bananas! Bubble Gum! Which One?
Students design and create a graph of data they have collected on their favorite candy bars. They explore how to organize data as well.
Curated OER
Closing the Case
Fifth graders collect data and prepare data displays using a survey with statistical information.
Curated OER
Graphing with the Five Senses
Students collect data and record it on a bar graph. In this data graphing lesson, each small group of students is assigned to collect data on one of the five senses. They then practice a song that helps them remember the purpose of each...
Curated OER
Awesome Animals
Students collect data from classmates about their favorite animal. They use the ClarisWorks graphing program to enter data, graph results, and interpret data.
Curated OER
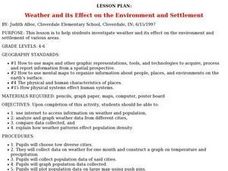
Weather and its Effect on the Environment and Settlement
Students, after choosing two diverse cities, collect data on weather for a month and construct a graph on temperature and precipitation. After collecting population data of said cities, and graphing it, they plot population on a large...
Curated OER
R-Project
Students analyze the outcome of a scientific experiment using free downloadable software. They collect experimental data to use statistical software to determine if the observations are likely due to the treatment or random chance.


