Willow Tree
Line Plots
You can't see patterns in a jumble of numbers ... so organize them! Learners take a set of data and use a line plot to organize the numbers. From the line plot, they find minimum, maximum, mean, and make other conclusions about the data.
National Council of Teachers of Mathematics
Eruptions: Old Faithful Geyser
How long do we have to wait? Given several days of times between eruptions of Old Faithful, learners create a graphical representation for two days. Groups combine their data to determine an appropriate wait time between eruptions.
Howard Hughes Medical Institute
Seed Dispersal in Tropical Forests
How do seeds get around? It's not like plants can control seed dispersal—or can they? Dig deeper into the amazing mechanisms of seed dispersal observed in tropical plants through interactives, a video, and plenty of hands-on data...
Bowland
Tuck Shop
Correct a misleading conclusion. Individuals review a set of data and a conclusion to determine what is wrong with the conclusion. Pupils then represent the data with an appropriate display. Finally, learners develop a correct conclusion...
Willow Tree
Circle Graphs
Pie isn't just for eating! Scholars learn to create pie charts and circle graphs to represent data. Given raw data, learners determine the percent of the whole for each category and then figure out the degree of the circle that percent...
EngageNY
Estimating a Population Proportion
Find the percent of middle schoolers who want the ability to freeze time. The 21st installment in a series of 25 has groups collect a random sample of respondents who answer a question about superpowers. Using sample statistics,...
Willow Tree
Scatterplots and Stem-and-Leaf Plots
Is there a correlation between the number of cats you own and your age? Use a scatter plot to analyze these correlation questions. Learners plot data and look for positive, negative, or no correlation, then create stem-and-leaf plots to...
Radford University
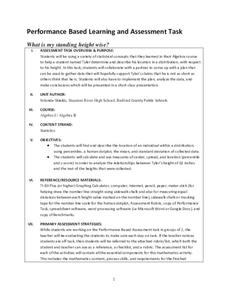
What is My Standing Height Wise?
Given a scenario in which a class member wants to prove his height is not an outlier, pairs devise a plan and gather evidence to help support his claim. The small groups implement their plans and create graphical displays of their data...
Magic of Physics
Shadows
Sunrise, sunset ... swiftly move the shadows! Pupils practice comparing shadow length data with a hands-on activity. The resource allows users to examine and measure the shadow cast by a stick as the sun moves overhead before testing...
American Statistical Association
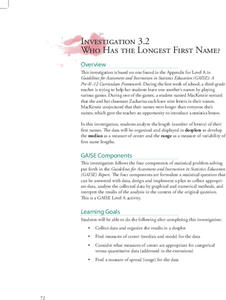
Who Has the Longest First Name?
Name that statistic! Classmates each write their name and the number of letters in it on a sticky note to place on the board. As a class, they determine the median, mode, and range of the name lengths, and create a dot plot of the data....
Curated OER
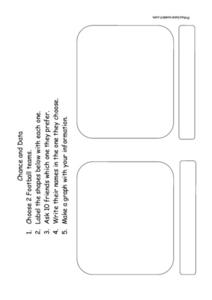
Chance and Data - Data Collection
In this data and probability worksheet, students choose two football teams and label the graphic organizer. They question 10 friends as to which team they prefer and write their names in the organizer. They make a graph that displays the...
Curated OER
Tables and Data
In this data analysis worksheet, 3rd graders answer eight short answer questions based on the information on the table. Students use the data from the table to answer the questions.
Curated OER
Interpreting Data and Building Hypothesis
Students define the term species, and graph species data together with previously collected data at the National Zoo. They interpret graphed data and recognize patterns in the streamside quadrant versus hillside quadrant. Students use...
Curated OER
Veggie Chop and Data Analysis
First graders chop vegetables into fractions. In this fractions lesson, 1st graders cut vegetables, collect data about favorite vegetables and create a bar graph using the information. Students make inferences about the data and record...
Curated OER
Exploring Data Sets and Statistics in Baseball
Young scholars explore the concept data sets. In this data sets lesson, students find the 5 number summaries for salaries of teachers and compare them with 5 number summaries of professional baseball players. Young scholars use box and...
Curated OER
Exploring Online Data Analysis Tools Project Interactivate- Plop It
In this data analysis activity, students access an online data analysis tool at the given web site. They collect name length data for classmates and enter it into the tool. The find and manipulate the data to determine how the median is...
Curated OER
Data Display
Students explore different ways to display data. In this statistics lesson plan, students create pie charts, bar graphs and line graphs to show data. Students then write a paragraph discussing which types of graphs are helpful for...
Curated OER
Data Analysis: Infiltration Rate and Composition of Concrete
Students collect and graph data. In this statistics lesson, students analyze data using a spreadsheet program. They display their data effectively and analyze it.
Curated OER
The Life Cycle of the Mealworm
Fourth graders provide a habitat for live mealworms and observe their life cycle. In this animal life cycle and scientific inquiry lesson plan, 4th graders create a habitat for a live mealworm and observe and record related data as it...
Raytheon
Data Analysis and Interpretation
For this data analysis and interpretation worksheet, learners use charts, graphs, statistics to solve 42 pages of problems with answer key included.
K20 LEARN
A Trait Accompli: An Introduction to Mendelian Genetics
Young scientists learn the laws of genetics through data collection and research. They use discussions and online resources to develop an understanding of the related vocabulary.
Curated OER
The Dog Days of Data
Learners are introduced to the organization of data This lesson is designed using stem and leaf plots. After gather data, they create a visual representation of their data through the use of a stem and leaf plot. Students
drawing...
Curated OER
What's Your Favorite Season?
Pupils collect data on the favorite seasons. In this data collection and analysis lesson, students learn about displaying data on charts and graphs. They collect data about the favorite seasons of the children in their class and display...
Curated OER
Designing a Speedometer
In this algebra worksheet, students analyze the designs of a speedometer. They collect data on the distance and time as the speedometer works. They draw conclusion and make predictions from the collected data. There are 4 word problems.
Other popular searches
- Collecting and Recording Data
- Collecting and Organizing Data
- Collecting and Graphing Data
- Collecting and Using Data
- Games on Data Collecting
- Collecting Weather Data
- Collecting and Comparing Data
- Patterns Data Collecting
- Math Data Collecting
- Patterns, Data Collecting
- Collecting and Charting Data
- Patterns\, Data Collecting


