American Statistical Association
Bubble Trouble!
Which fluids make the best bubbles? Pupils experiment with multiple fluids to determine which allows for the largest bubbles before popping. They gather data, analyze it in multiple ways, and answer analysis questions proving they...
Discovery Education
Fuss About Dust
Dust is everywhere around us; it's unavoidable. But what exactly is dust and are certain locations dustier than others? These are the questions students try to answer in an interesting scientific investigation. Working independently or...
Workforce Solutions
Miniature Gulf Coast Project
Scholars show what they know about data collection and analysis with an activity that examines a smaller population of Houghton, Texas. Independently or in pairs, learners identify their research question, gather, graph, and analyze...
Illustrative Mathematics
Favorite Ice Cream Flavor
What better way to engage children in a math lesson than by talking about ice cream? Using a pocket chart or piece of chart paper, the class works together creating a bar graph of the their favorite ice cream flavors. Learners then work...
Curated OER
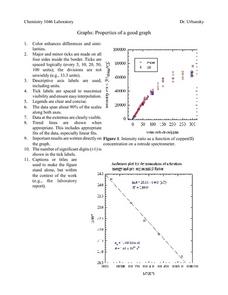
Properties of a Good Graph
For this chemistry worksheet, students examine the common characteristics of an acceptable graph that is meant to be used to display data.
American Institutes for Research
Data and Probability: Marshmallow Madness
Upper grade and middle schoolers make predictions, collect data, and interpret the data as it relates to the concept of probability. They work with a partner tossing marshmallows and recording if they land on their side or on their...
Curated OER
Frequency Tables; Discrete Ungrouped Data
For this frequency tables worksheet, students utilize given data to work out three frequency charts with one containing values and a pie chart involving angles for each value. Students complete three vertical line diagrams and check all...
Curated OER
Data Collection - Primary Poster
Students explore the concept of collecting, analyzing, and graphing data. In this collecting, analyzing, and graphing data lesson, students create a survey about a topic of interest. Students poll their classmates, analyze, and graph...
Curated OER
Gathering Data About Respiration
Students engage in an experiment that tests how much air we breathe in and out during the respiration process. For this respiration lesson, students blow a typical breath's amount of air into a balloon. They use a ruler to measure the...
Curated OER
Collecting Data
In this algebra worksheet, students collect and analyze data. They graph and identify their solutions. There is one question with an answer key.
Curated OER
Representing Data
Second and third graders answer questions based on data presented to them in graphs. They see how to interpret data from a bar graph, line graph, and a chart.
Houston Area Calculus Teachers
Collecting Driving Data
Give AP Calculus classes the opportunity to check the accuracy of their calculations! A calculus activity involves the collection of data, the application of mathematics, and the analysis of the accuracy of results. Young mathematicians...
Teach Engineering
Using Hooke's Law to Understand Materials
Provide a Hooke for a lesson on elasticity with an activity that has groups investigate a set of springs. They use a set procedure to collect data to calculate the spring constant for each spring using Hooke's Law. The groups predict the...
Equality and Human Rights Commission
Learning area 4: Learn About the Meaning of Community
Scholars examine the jobs found in their community by way of surveying. After collecting data, pupils analyze their findings and share their observations with their peers. A video sparks interest. Two posters motivate participants to...
Alabama Learning Exchange
Wheels All Around
Budding mathematicians explore the concept of skip counting. They practice skip counting as they use it to determine the number of wheels that come to school at 3 different times throughout the day. They also create a data graph to show...
Teach Engineering
Storing Android Accelerometer Data: App Design
There's an app for that! Pupils learn to build an app that will store data on an Android. The instructional activity introduces class members to the tiny database, TinyDB, for Android devices. A video tutorial provides an example that...
Curated OER
A Planting We Will Go
Even the youngest kids can make scientific comparisons using collected data. They read The Tiny Seed, then discuss the essential nutrients and elements needed for a seed to grow into a blooming plant. They plant seeds and track their...
Curated OER
Estimate and Compare Data
Seventh graders explore the values that are used in order to describe data that is collected or given. They compare data using the statistical analysis provided by finding the mean, median, and range.
Curated OER
Probability Lesson 3
Here are a few well-thought-out discussion questions intended to accompany a probability activity. Learners consider equal chance outcomes under given situations, they investigate those outcomes by tossing a coin 30 times. They analyze...
Curated OER
Stream Consciousness
Actual stream water is analyzed in this environmental science activity. Participants measure water temperature and pH, and then survey the macroinvertebrates living in their samples. The data worksheet, troubleshooting tips, and...
Corbett Maths
Quantitative and Qualitative Data
Classify the Big Ben of all data with a video that defines quantitative and qualitative data. Given data about Big Ben, the presenter classifies each piece based upon the definitions. In the Types of Data worksheet, individuals show they...
Curated OER
Using Matrices to Enter Data and Perform Operations
Here's a TI step by step guided lesson on matrices. The class enters data into the TI calculator about movie ticket sales and uses matrices as a problem solving tool. They add and multiply matrices to determine profit.
Earth Watch Institute
Entering Local Groundhog Data in an Excel Spreadsheet
Here is a cross-curricular ecology and technology instructional activity; your learners create spreadsheets depicting the location and number of groundhog dens in a local park. They research groundhogs and analyze data about where the...
Curated OER
Graphs that Represent Data Sets
These four scenarios all contain graphable data; can scholars match them to the correct bar graphs? All the data is in single-digit whole numbers. Some of the scenarios instruct kids to make a graph, while others don't. Clarify...
Other popular searches
- Collecting and Recording Data
- Collecting and Organizing Data
- Collecting and Graphing Data
- Collecting and Using Data
- Games on Data Collecting
- Collecting Weather Data
- Collecting and Comparing Data
- Patterns Data Collecting
- Math Data Collecting
- Patterns, Data Collecting
- Collecting and Charting Data
- Patterns\, Data Collecting


