Curated OER
Study Buddies - Bar Graphs
In this data collection worksheet, learners work with a partner to make 3 small bar graphs after finding the proper number of circles on the first page. They look at a page of a variety of shapes and separate the circles into black,...
Curated OER
M&M's Candies Worksheet Graph
In this graphing worksheet young scholars will record data on a bar graph. Students will take a bag of M&M's and chart the colors they find inside this bag.
Curated OER
St. Patrick's Day Lucky Charms Sort Bar Graph
In this elementary data collection and graphing worksheet, students paste the correct cereal pieces to match the words at the bottom of the bar graph. They count the items and fill in the graph in this St. Patrick's Day themed activity.
Curated OER
Handling Data: Representing Date - Online Version
Here is an online lesson plan on data representation. In it, learners access websites embedded in the plan which lead them through a variety of activities around data representation and statistics. The activities are quite good, and...
Curated OER
Kindergarten Class Favorites
Students discuss their favorite foods, a list of four favorite food are compiled on the board or a chart. They each vote for their favorite food and the data is entered onto a spread sheet and a graph is created while the students watch...
Curated OER
What's Your Shoe Size? Linear Regression with MS Excel
Learners collect and analyze data. In this statistics lesson, pupils create a liner model of their data and analyze it using central tendencies. They find the linear regression using a spreadsheet.
Curated OER
Your Tax Dollars at Work
In order to understand how tax dollars are spent, young economists use given data and graph it on a circle graph. Circle graphs are highly visual and can help individuals describe data. A class discussion follows the initial activity.
Curated OER
Play It
There are a number of activities here that look at representing data in different ways. One activity, has young data analysts conduct a class survey regarding a new radio station, summarize a data set, and use central tendencies to...
Curated OER
Make a Frequency Table and a Histogram for a Given Set of Data
In this data recording and data organization worksheet, students create one frequency table and one histogram for a given list of data. Explanations and examples for frequency tables and histograms are given.
Curated OER
Data Collection Project
Students collect data using email. They calculate the mean, median, mode, range and outliers. They create a graph using the data results. They write five paragraphs to summarize their data.
Curated OER
Hit and Run
Pupils explore data collection in this lesson. They investigate distance vs. time and velocity vs. time graphs using information collected with a CBR 2 to simulate the reconstruction of an accident.
Curated OER
Statistics and Probablility
Statistics and Probability are all about collecting, organizing, and interpreting data. Young learners use previously collected data and construct a picture graph of the data on poster board. This stellar lesson should lead to...
Curated OER
Survey Says...
Young statisticians collect, organize, and present data to illustrate responses to a survey question. They write and conduct the survey. They finish by presenting the results in the form of a graph.
Curated OER
Twelve Days of Christmas--Prediction, Estimation, Addition, Table and Chart
Scholars explore graphing. They will listen to and sing "The Twelve Days of Christmas" and estimate how many gifts were mentioned in the song. Then complete a data chart representing each gift given in the song. They also construct...
Curated OER
Valentine Candy Count
Here is an imaginative take on a classic lesson! Young scholars discover what color Valentine Candy is found more often than any other in a standard bag of Valentine Conversation Hearts. They observe, predict, sort, and classify the data...
Curated OER
Classroom Census (Analyzing Data)
Learners create graphs. In this data analysis lesson plan, students fill out a student census and then use the data collected to produce graphs. Learners write paragraphs interpreting the data.
Curated OER
Representing Data 1: Using Frequency Graphs
Here is a lesson that focuses on the use of frequency graphs to identify a range of measures and makes sense of data in a real-world context as well as constructing frequency graphs given information about the mean, median, and range of...
Curated OER
Representing Data 2: Using Box Plots
What information can be gleaned from a box and whiskers plot? Discuss the five summary values - minimum, maximum, upper and lower quartiles, and median - and what conclusions can be made from these values? Included here is a matching...
Curated OER
Measurement Mix-Up
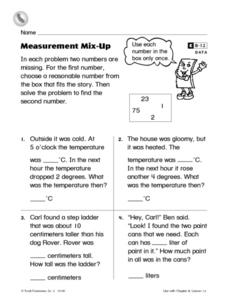
For this measurement worksheet, 2nd graders read 4 word problems and find the two numbers missing in each one. Students choose a reasonable number from the box that fits the story for the first number and then solve the problem to find...
California Education Partners
Science Fair Project
Plant the data firmly on the graph. Given information about the growth rate of plants, pupils determine the heights at specific times and graph the data. Using the information, scholars determine whether a statement is true and support...
American Statistical Association
Armspans
Young mathematicians collect data on the arm spans of classmates. Then they sort the data by measures of center, spread, and standard deviation. Finally, they compare groups, such as boys and girls, to interpret any differences.
Statistics Education Web
The Egg Roulette Game
Hard boiled or raw? Which egg will you get? A hands-on activity has scholars explore the impact of conditional probability. Based on a skit from the Tonight Show, pupils model the selection of the two types of eggs using beads. They...
Achieve
BMI Calculations
Obesity is a worldwide concern. Using survey results, learners compare local BMI statistics to celebrity BMI statistics. Scholars create box plots of the data, make observations about the shape and spread of the data, and examine the...
Shodor Education Foundation
Scatter Plot
What is the relationship between two variables? Groups work together to gather data on arm spans and height. Using the interactive, learners plot the bivariate data, labeling the axes and the graph. The resource allows scholars to create...


