Curated OER
Closing the Case
Fifth graders collect data and prepare data displays using a survey with statistical information.
Curated OER
Our Animal Friends
Students use the internet to find information pertaining to the benefits of pets. They list their results on a database. They find and record data on the percent of households that own pets as well as the top six species of pets. Once...
Curated OER
Collect Your Own Drosophila Lab
Students study Drosophila by catching them. They construct catcher-containers to catch Drosophila using fruit as bait. After collection, they examine the flies and collect data to be displayed.
Curated OER
Scientific Investigation- Magnets
Students conduct a scientific investigation to determine if a magnet attracts paper clips through different materials. Students write out their procedures, collect data and present it in a table or chart, and analyze their results.
Curated OER
Recording Frequency
First graders analyze nursery rhymes and gather data about word frequency. In this frequency lesson, 1st graders create graphs and tables. Students interpret the data.
Curated OER
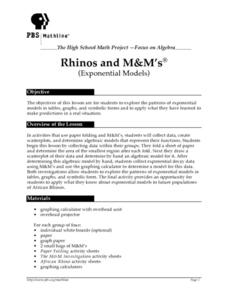
Rhinos and M&M's
Students analyze patterns of exponential models by collecting data in paper folding and M&M investigations. They use graphing calculators to create scatter plots that lead to equations for the exponential models. They then apply this...
Curated OER
Infusing Equity Gender into the Classroom
Students investigate if gender makes a difference in the classroom. In this statistics lesson, students collect data on whether equity by gender in the classroom makes students more successful.
Curated OER
What Would Make Our School More "Green"?
Students survey their school to get ideas for how to make the school more environmentally friendly. In this environmental lesson plan, students collect data from other students and teachers. They use the data to create graphs and present...
Curated OER
Plant Systems
Second graders learn about plant systems and how plants grow and function. In this plant lesson plan, 2nd graders collect data based on roots, leaves, terrariums, plant uses, and locations of certain kinds of plants. They fill out...
Curated OER
Polluting the Environment
Fourth graders construct mini-ecosystem, pollute the ecosystem, observe, collect, and record data on the effects of these pollutants on their ecosystem, organize data on spreadsheets, create graphs, and design presentations to share with...
Curated OER
Mean Meadian and Mode
Students apply central tendencies to given data. In this statistics lesson, students calculate the mean, median, and mode as it relates to their data. They collect data and graph it while identifying the way the numbers are ordered.
Curated OER
Lobster Roll!
Students collect data by playing a game that illustrates the delicate ecological balance between fishing, fishing regulations and fish populations. They graph and analyze the data and explain how economic decisions can affect the...
Curated OER
Bottle Habitat
In groups of four, students construct aquatic habitats in pop bottles. They create charts and record data from observations over a four week period. Then they graph their data and write explanations for what they observed.
Curated OER
River Optimization Problem
Students define the different methods used for optimizing a particular element of a problem. In this optimization problem lesson, students optimize appropriate details of a problem using data collection, algebra, technology, and/or...
Curated OER
A Steep Hike
Students explore slope. In this middle school mathematics lesson plan, students analyze and interpret graphs as they investigate slope as a rate of change. Students use a motion detector to collect data as they walk at different speeds...
Curated OER
After the Garbage Can: Where Does Our Trash Go?
Learners explore how waste disposal has changed over time and what the current issues are. In this disposal instructional activity students collect data and create graphs.
Curated OER
Microclimates of Our School
Students read the story "Weslandia" by Paul Fleischman, define the term microclimate, gather and record data in various places on school grounds to establish the presence of difference microclimates, analyze and compare microclimates,...
Curated OER
Weather "Whys" Lesson 2 Seasons
Young scholars explore seasons. In this cross curriculum weather and seasons lesson plan, students identify characteristics of the four seasons and sequence related pictures. Young scholars listen to poems and stories about trees in...
Curated OER
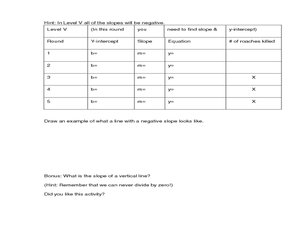
Cockroach Slope
Students identify the slope of linear functions. In this slope lesson, students collect data and graph it. They write equations with no more than two variables and use technology to explain their data.
Curated OER
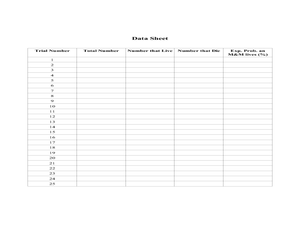
RIP M&M's
Students solve theoretical probability problems. In this algebra lesson, students apply the concept of probabilities to solving real life scenarios. They collect data and graph it using experimental probability.
Curated OER
Paint Property Experiments
Students identify various kinds of paints by using the scientific method. In this solvents lesson students collect data and identify paint samples while working in teams.
Curated OER
Poetic Math Greeting Cards
Fourth graders work in groups; collect data in a survey; depict in tables, charts, or graphs the results of the survey; and make predictions. They use creative writing skills and computer skills to generate a greeting card of their own.
Curated OER
Pick's Theorem
Students investigate polygons and their lattice. In this calculus lesson, students record data using different methods. They analyze their data and draw conclusions based on the relationship between the area and the interior lattice.
Curated OER
Displaying Populations: Jellybeans, Paper and People
Students investigate the factors affecting population growth. In this biology lesson, students collect data from the lab and graph them. They estimate population size using a mathematical formula.


