Curated OER
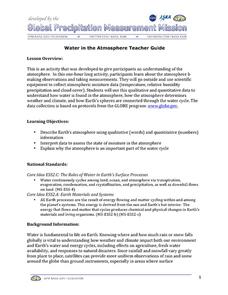
Water in the Atmosphere
A slide show serves as the backdrop for a instructional activity on the moisture in Earth's atmosphere. Through it, mini meteorologists learn about the attributes of the atmosphere and actually use data-collecting weather tools to make...
Curated OER
Natural Selection
Kids act as scientists and preditors in this short natural selection activity; they collect and analyze data, then apply their new knowledge to real-world examples of natural selection. The layout of the worksheet is easy enough to use...
Curated OER
Temperature Bar Graph
Students explore mean, median and mode. In this math lesson, students analyze temperature data and figure the mean, median, and mode of the data. Students graph the data in a bar graph.
Curated OER
Countdown to Disaster
Students discover the potential dangers of weather in their hometown. In this environmental lesson, students research Hurricane Hugo and the devastation it caused South Carolina in 1989. Students record weather data from their city and...
Curated OER
Probability
Third graders conduct experiment, collect data, predict, record, and discuss outcomes, and analyze data for probability.
Curated OER
"Weather" or Not?
Students complete a three week unit about weather and how it affects our behavior. They read and discuss various books related to weather, conduct an experiment about the tilt of the earth, plan a field trip based on temperature,...
Curated OER
Probing Under the Surface
Eighth graders use a measuring stick to determine the shape of the inside of the bottom of a box, then apply their knowledge to an additional situation. This task assesses students' abilities to make simple observations, collect and...
Curated OER
Ready, Set, Drift!
Students define data, recover data from the Internet, and use information they obtain to solve problems. In this investigative instructional activity students answer questions on a worksheet and demonstrate the use of a maneuvering...
Curated OER
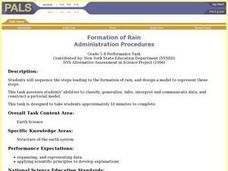
Formation of Rain
Students sequence the steps leading to the formation of rain, and design a model to represent these steps. This task assesses students' abilities to classify, generalize, infer, interpret and communicate data, and construct a pictorial...
Curated OER
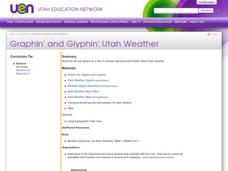
Graphin' and Glyphin' Utah Weather
Fourth graders use glyphs as a way to visually represent information about Utah weather. These nonverbal representations help students collect and interpret data in a visual format.
Curated OER
Using Radiosonde Data From a Weather Balloon Launch
Student use radiosonde data from a weather balloon launch to distinguish the characteristics of the lower atmosphere. They learn the layers of the atmosphere. They graph real atmospheric data.
Curated OER
Weather Lesson Five
Students define a weather forecast, make a forecast using a weather map, identify three prediction guidelines, and explain how computers help to make forecasts. Students make a 24-hour forecast for each of the thirteen states targeted.
Texas Instruments
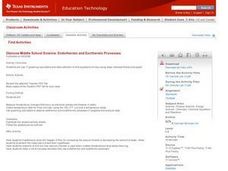
Endothermic and Exothermic Processes
Students investigate temperature using the TI. In this chemistry lesson, students analyze the change in temperature, as chemicals are dissolved in water. They analyze data collected using the CBL 2.
Curated OER
And Now, the Weather...
Students collect and analyze data. In this middle school mathematics/science lesson, students collect temperature reading over a 24 hour period. Students analyze the data for mean, median, maximum and minimum.
Curated OER
Weather "Whys" : Introduction to Weather
Students discuss weather forecasts and different types of weather. In this weather instructional activity, students observe the weather and learn a weather song. They listen to a story and see weather measurement tools.
Curated OER
Observing and Predicting Weather from a Weather Station
Fourth graders us a Weather Log data chart to record the date, time, day, and weather. They discuss different instruments and charts needed to record the information. Students turn in their weather logs at the end of two weeks and...
Curated OER
Storm Clouds-- Fly over a Late Winter Storm onboard a NASA Earth Observing Satellite
Students study cloud data and weather maps to explore cloud activity. In this cloud data lesson students locate latitude and longitude coordinates and determine cloud cover percentages.
Curated OER
A Comparison of Cloud Coverage over Africa
Young scholars identify different climate regions and local weather patterns. For this cloud coverage lesson students use NASA satellite data and import it into Excel.
Curated OER
Weather v. Climate
Ninth graders discuss the differences between climate and weather as a class. Using data they collected, they create a graph of the data to share with the class over a specific time period. They compare and contrast this data with...
Curated OER
Clam Shell Data Collection Sheet
In this clam shell worksheet, students collect data about 10 clams and measure their length and width. They identify if the clam has a hole or not in its shell and they indicate the location profiled, date, time of day, tidal stage and...
Curated OER
MAISA and the REMC Association of Michigan
Students complete online research to study geography's impact on weather. In this geography and weather lesson, students research weather in their city for ten days using an online website. Students bookmark the site, enter data into a...
Curated OER
Probability: The Study of Chance
Students conduct an experiment, determine if a game is fair, and collect data. They interpret data, then display line graph. They conduct analysis of game for probability.
National Wildlife Federation
I Speak for the Polar Bears!
Climate change and weather extremes impact every species, but this lesson focuses on how these changes effect polar bears. After learning about the animal, scholars create maps of snow-ice coverage and examine the yearly variability and...
Curated OER
Weather "Why"
Students research weather and explore how to use their research information. In this weather information lesson, students visit a given website for weather forecasts. Students graph the weather, sing weather songs and select a class...


