Howard Hughes Medical Institute
Using Genetic Crosses to Analyze a Stickleback Trait
Two fish appear different, but how do scientists determine their genotypes? Scholars practice performing test crosses to determine the genotypes of fish given their phenotypes. They answer in-depth comprehension questions and complete...
Radford University
Body Measurement Activity
Don't keep the resource at an arm's length. A hands-on activity has scholars measure the heights, arm spans, hair lengths, and foot lengths of their classmates. They create scatter plots to determine if there is a correlation between...
Actis
Handling Data: Probability, Tree Diagrams
Clean, but captivating, two online simulations demonstrate probability for middle schoolers. They can choose the number of coins and tosses and watch as the results pile up. They can choose from a variety of spinner types and the number...
K20 LEARN
Round and Round We Go
Connect the dots on trigonometry with K'nex. Scholars use a K'nex model of a Ferris wheel to collect data points to plot on a height versus time graph. They'll then consider what type of function best models the data in the graph—and...
Radford University
Got Slope?
Go around and around with slope. The class investigates tornadoes by watching videos, building a homemade tornado, and performing research on the Storm Prediction Center website. Groups gather data and create scatter plots for twisters...
National Wildlife Federation
How Do You Feel About Water?
Less than one percent of the water on Earth is usable in people's homes. As pupils consider this fact, they reflect on their own water usage before designing a survey to collect information on water usage by others. They then analyze...
Balanced Assessment
Movie Survey
Movie preferences will get your classes talking! Individuals read a pie graph and construct a bar graph using the same information. They then answer questions specific to the data and sample size.
iCivics
Campaign Cash: Money Talks!
Money talks! And it can reveal a lot about political candidates. An 11-slide presentation examines how candidates raise and spend money on an election. The slides, using data from the 2016 Presidential election, reveal how much it costs...
Baylor College
Body Strength
Your young learners will discover how muscular strength and endurance can increase with this truly hands-on activity! Beginning by writing an acrostic for the word strength, class members then engage in tracking their ability to squeeze...
Curated OER
Population Growth in Yeasts
Students design an investigation using yeast. In this environmental engineering lesson, students design an investigation to determine how environmental factors affect the growth of yeast. They will collect quantitative data and discuss...
Curated OER
Collecting My School Family Data
Pupils are tasked with collecting data on their school. In groups, they collect data on various aspects of school life along with social and economic backgrounds and charactertics of their hair and eye color. They draw two pictures,...
Curated OER
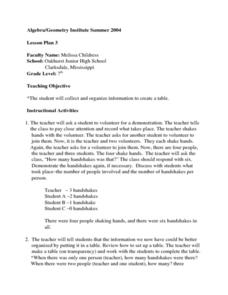
Creating a Data Table
Seventh graders explore organizing data into a table. The teacher leads a handshaking activity among the class. They collect the information concerning the number of handshakes each person received. Students discover a pattern. They...
Curated OER
Go Fish! Student Worksheet
A math and science worksheet prompts learners to simulate how scientists determine populations of animals out in the wild. They use goldfish crackers, paper bags, and a styrofoam cup as their tools. An excellent cooperative group activity!
Intel
Forensics: Get a Clue
Although the methods are all scientific, forensic science was started by police officers rather than scientists, who relied on observation and common sense. Young detectives use many tools to solve crimes around the school in a...
Curated OER
Ocean Temperatures
Students list data collected by marine buoys and the different kinds of moored buoys. They describe how data is transmitted worldwide. They explain the difference between near shore and offshore air and water temperatures.
Curated OER
Misleading Graphs
Students explore number relationships by participating in a data collection activity. In this statistics instructional activity, students participate in a role-play activitiy in which they own a scrap material storefront that must...
Curated OER
The Great Race
Students identify the mean, median and mode of collected data. In this statistics instructional activity, students collect, graph and analyze data using central tendencies. They work in groups to collect data on a robot through an...
Curated OER
Acid-Base Titration
Students determine the concentration of an unknown solution. This task assesses students' abilities to state hypothesis, develop procedures for investigation, plan for recording and organizing observations and data, collect data, create...
Curated OER
Our Favorites
Students participate in and conduct a survey to determine various class favorites. They collect, organize and display their data, interpret the results, and complete a packet of worksheets to display the information.
Curated OER
Bats and Hot Dogs
Students identify patterns and relationships from data that is collected and solve variables. In this investigative lesson students study ocean productivity, the nitrogen cycle and phytoplankton then answer questions.
Curated OER
Wildlife and Highway Management
Students create a research questions about animal underpasses and how animals use them. In this animals lesson plan, students use their collected data to answer their question.
Curated OER
Color Tile Graphing
Students explore data. They gather data and generate questions about the data in pictographs, tallies, tables, and bar graphs. Students use color tiles pulled by random to create their own bar graph. They discuss the bar graphs they...
Curated OER
Getting A Grip On Graphs
Fourth graders investigate the concept of graphing and comparing different types of data using pictographs, line graphs, scatter plots, etc... They gather data and make interpretations while examining the medium of how it is displayed.
Curated OER
La Toteca- A Tropical Paradise
Young scholars collect data on the time of the ferry. In this algebra lesson, students use the data to predict a ferry schedule. They also compute the depth where oxygen would be needed when diving.
Other popular searches
- Data Collection
- Collecting Data
- Collecting and Recording Data
- Collect Data
- Data Collection Techniques
- Math Lessons Data Collection
- Data Collection Activity
- Data Sets Data Collection
- Data Collection and Median
- Data Collection and Graphs
- Data Collection Projects
- Data Collection and Analysis


