Curated OER
Probability
In this problem solving worksheet, students determine which spinner will most frequently land on a color choice of a color wheel. In this coloring and multiple choice worksheet, students will answer two questions.
Curated OER
Which Muscles?- Olympic Learn and Play Sports
In this math, science, and physical education activity, students brainstorm and study about the muscles that are used while participating in different Olympic sports. They color the muscle groups of the body by follow the directions...
Curated OER
It's Easter! Ordinal Numbers 1st-5th
In this Easter math worksheet, students solve 5 problems in which the correct Easter picture is colored to show the given ordinal number. Example: Color the 4th basket.
Curated OER
Jelly Bean Sort Record Page
In this Easter themed math activity, learners sort jelly beans by color and record the number of each on this chart. They fill in 3 blanks by telling which color had the most, which had the least, and which color is their favorite.
Curated OER
Fruit Loop Graphing
Fifth graders interpret data and create graphs. Given Fruit Loops, they sort and classify according to color. Using spreadsheet technology, 5th graders record their data and create bar and circle graphs. Students analyze data and...
Curated OER
Easter Addition
In this Easter addition worksheet, young scholars problem solve and calculate the answers to twenty-five addition equations and color all of the Easter eggs that have an even numbered sum.
Curated OER
Easter Addition
In this Easter addition worksheet, students problem solve and calculate the answers to twenty-five addition equations and color all of the Easter eggs that have an even numbered sum.
Curated OER
Solids in the Playground
First graders locate and identify solids in the schoolyard. For this geometric solids lesson, 1st graders locate two solids on the playground. They work as a group to compare and contrast them according to shape, texture, weight, size,...
Math Mammoth
Parallel & Perpendicular Lines
In this geometry learning exercise, 4th graders list the lines that are parallel or perpendicular to each other. Then they mark with one color the line segments that are parallel and another color those that are perpendicular.
Curated OER
Pent-up Pentominoes
Students explore pentominoes in this activity. They build shapes as directed and color the tiles on their grid sheet.
Curated OER
Marble Grab Bag: Certainly? Maybe? Impossible?
Second graders use a hands-on activity and a data chart to explain the certainty, probability, or impossibility of drawing a particular color of marble from a bag. This instructional activity comes with an excellent website, and many...
Alabama Learning Exchange
The Grouchy Ladybug
Students listen to the book, "The Grouchy Ladybug" by Eric Carle and sequence the events in the story. Using a graph, they draw and color the animals that the ladybug meets next to the corresponding time from the story, and conduct...
Curated OER
Counting Candies
Students count, sort, and classify jellybeans by color. They use their data to create a bar graph. Students are given a small bag of jellybeans, and a worksheet on Counting Candies Tally Chart. They work in small groups. Students are...
Curated OER
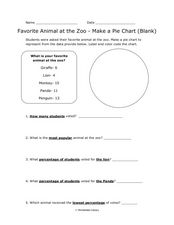
Pie Chart: Favorite Animal at the Zoo
In these three interpreting a pie chart and answering questions worksheets, learners use the data provided to label and color code the blank and outlined pie charts, read and interpret a completed pie chart, and then answer questions...
Math Mammoth
Recognize Fractions
In this fractions activity, students use the shaded figures and write fractions based on the shaded area to the whole area. Students also learn how to draw pie models. Students divide the circle into fractions and color the right amount...
Curated OER
Put the Elephant First
Students recreate the order of animals they read about in a book. In this relative positions lesson, students color and cut out pictures of animals in the book. Sudents glue these onto construction paper and line up like the animals...
Curated OER
Percentages Introduction
In this percentages worksheet, students color 25% of 100 small squares blue, 35% red and 30% yellow. Students figure out how many squares they have left and then what percent of the 100 squares are left. Students then work out 5...
Curated OER
How Many Feathers?
In this recognizing how many feathers worksheet, students read numbers on turkeys, draw that number of tail feathers on the turkeys, and color them. Students draw eight groups of feathers.
Curated OER
Larger and Smaller Numbers
In this comparing numbers from one to twenty worksheet, students observe numbers in groups of four boxes, compare the numbers, and color each box with the largest number. Students color 4 boxes.
Curated OER
Sight
Students discover how the sense of sight helps us recognize each other and explore color, motion and distance.
Curated OER
Heredity Mix 'n Match
Students randomly select jelly beans that represent genes for several human traits such as tongue-rolling ability and eye color. Then, working in pairs (preferably of mixed gender), students randomly choose new pairs of jelly beans from...
Curated OER
Pies and Percentages--Learning About Pie Graphs
In this pie graph worksheet, students draw a pie graph for the zookeeper with the data he collected, choose a different color for each animal species and make a key to the graph.
Curated OER
Build A Skittles Graph
Students explore graphing. In this graphing lesson, students sort Skittles candies and use the color groups to create a bar graph. Rubrics and extension activities are provided.
Curated OER
The Shapes of Rice
Students investigate geometry by identifying shapes related to rice and rice farming. In this geometry lesson, students discuss the different shapes used in rice agriculture and discuss what other objects in our lives use that same...


