Curated OER
Valentine Candy Count
Students analyze a bag of Valentine candy to create a graph. In this graphing lesson, students make predictions, sort by color, record data and make a graph. Students discuss results and make generalizations. Students generate their own...
Lakeshore Learning
Equivalent Fraction Activities
Spin the wheel of the fraction contraption and learn about equivalent fractions! After constructing their own spinners, kids use printable pizzas to represent fractions that are equal in value.
Curated OER
Generating and Recording Data
Students demonstrate their ability to collect, organize, and display data. They examine everyday objects that can be turned into a function machine for the instructional activity. They use colored fish to help them organize their data.
Curated OER
Satellites and Solar Cells
In this satellite and solar cells worksheet, learners determine the electrical power generated by the solar cells on the IMAGE satellite. Students solve 3 problems including finding the usable area of the satellite, determining the power...
Curated OER
Counting Chart
Elementary learners discover counting through a counting chart. In this math lesson, students identify numbers 1-100. They then point or recite their counting numbers.
Alabama Learning Exchange
Jelly Beans Add Up
Students explore counting, sorting, and graphing skills. In this data analysis activity, students sort jelly beans by color, count the jelly beans, and create a bar graph of the jelly beans according to color.
Curated OER
MAPPING YOUR NEIGHBORHOOD
Students uses atlases, maps, and Web resources to generate and examine maps of their own neighborhoods. This activity serve as background for the map-reading tasks in the next lessons.
Curated OER
Probability
Young scholars explore the concept of probability. In this probability lesson, students perform various probability experiments involving dice, coins, and drawing colored balls from a bag. Young scholars use knowledge of permutations and...
Curated OER
Eighteenth and Nineteenth Century Natural Dyes
Second graders explore the work of Americans when it came to coloring materials. In this interdisciplinary instructional activity, 2nd graders follow the provided steps to make natural goldenrod dye from scratch.
Curated OER
Heredity Mix 'n Match
Students randomly select jelly beans that represent genes for several human traits such as tongue-rolling ability and eye color. Then, working in pairs (preferably of mixed gender), students randomly choose new pairs of jelly beans from...
SMART Project
Shop with Us at Whelan School
Third graders use their math and research skills to create and manage a classroom/school store. They use a computer to manage, organize and access information. They practice pricing products, computing sales, counting money and...
Curated OER
Gravity, Angles, and Measurement
Learners relate math to real life scenarios. In this geometry lesson, students launch a ball tracking each launch using a graph. They analyze their data for speed, angles and distance, trying to improve on each launch.
Curated OER
My Extraterrestrial Counting Book
In this extraterrestrial counting worksheet, students assemble and color a mini personal book on counting from one to ten with extraterrestrial objects.
Curated OER
Weather Reporter
Fourth graders generate an oral presentation on the weather. In this weather instructional activity, 4th graders watch the weather for a week and record the data on a chart. Students give a weather report at the end of the week.
Curated OER
Squares, Square Roots, and Exponential Expressions
Young scholars explore the concepts of square roots and exponential expressions. In this square root and exponential expression lesson, students complete an investigation called Building A Square Patio. Young scholars use color tiles to...
Illustrative Mathematics
Waiting Times
Probability prevails in this assignment as youngsters determine the probability of finding a blue pen in a cereal box when they can come in blue, green, yellow, or red. Learners set up a simulation to determine the outcome of compound...
Federal Reserve Bank
Your Budget Plan
What do Whoosh and Jet Stream have in common? They are both characters in a fantastic game designed to help students identify various positive and negative spending behaviors. Through an engaging activity, worksheets, and...
Curated OER
Copy Cat
Students examine a Webmath page, and demonstrate how to copy and paste. They create a computer-generated template page presenting the attributes of two- and three- dimensional shapes.
Curated OER
Getting Familiar with Fractals
Pupils use the Internet to answer lab questions about fractals, and then construct fractals using the initial stage and iteration rule. They complete tables and generate rules for the "nth" term and create their own fractals.
Curated OER
Mathematics Witing: Algebraic Processes and Its Connections to Geometry
Young scholars, using manipulatives, determine how many different ways there are to arrange 3 and 4 objects. They organize and record their arrangements. Students investigate the pattern generated by 3 and 4 objects, they predict how...
Curated OER
Designing a Quilt Pattern
Students create and color a one-patch quilt design based upon a regular hexagon. They examine quilts and photos of quilt designs, read a handout, and complete their quilt design on a worksheet.
Curated OER
A Bar of Many Colors
Second graders use colored candies to collect data, construct double bar graphs, and find averages.
Curated OER
Patterns in Nature
Pupils learn about artist Larry Schulte and view examples of his work. They create addition sentence for the first seven numbers of the fibonacci sequence and use unifix cubes to build that sentences. Students color and create three...
Curated OER
Measuring Natural Objects
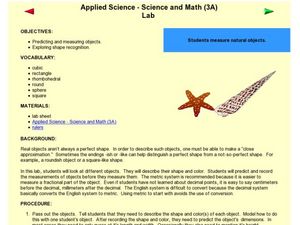
Students predict the measurement of objects. In this measurement lesson, students estimate the measurements of objects in a lab. Students measure irregular objects and generate scientific observations.


