Noyce Foundation
On Balance
Investigate the world of unknown quantities with a creative set of five lessons that provides problem situations for varying grade levels. Each problem presents a scenario of fruit with different weights and a balance scale. Using the...
Noyce Foundation
Measuring Mammals
Explore the meaning of scale and proportion with a set of five activities that examines the topic from elementary through high school. The first lessons explore ratio by examining pictures of different sizes. The next three activities...
Statistics Education Web
You Will Soon Analyze Categorical Data (Classifying Fortune Cookie Fortunes)
Would you rely on a fortune cookie for advice? The instructional activity first requires future statisticians to categorize 100 fortune cookie fortunes into four types: prophecy, advice, wisdom, and misc. The instructional activity goes...
Intel
Track the Trends
Allow your classes to research what interests them. An engaging STEM lesson, the fourth in the series of six, asks individuals to choose a topic of interest and analyze the data through regression models. The regression equations allow...
Albert Shanker Institute
Economic Causes of the March on Washington
Money can't buy happiness, but it can put food on the table and pay the bills. The first of a five-lesson unit teaches pupils about the unemployment rate in 1963 and its relationship with the March on Washington. They learn how to create...
Curated OER
Making History....Literary
Connect the Common Core ELA standards with history by employing a balanced literacy approach to reading.
S2tem Centers SC
Investigating Chance Processes of Probability
How likely is it that the school cafeteria will serve chicken tomorrow? Discover the concept of probability with the roll of the dice. Pupils evaluate the liklihood of several statments about everyday life. Then, a mathematical...
Inside Mathematics
Marble Game
Pupils determine the theoretical probability of winning a game of marbles. Individuals compare the theoretical probability to experimental probability for the same game. They continue on to compare two different probability games.
Noyce Foundation
Sewing
Sew up your unit on operations with decimals using this assessment task. Young mathematicians use given rules to determine the amount of fabric they need to sew a pair of pants. They must also fill in a partially complete bill for...
Noyce Foundation
Mixing Paints
Let's paint the town equal parts yellow and violet, or simply brown. Pupils calculate the amount of blue and red paint needed to make six quarts of brown paint. Individuals then explain how they determined the percentage of the brown...
Inside Mathematics
Archery
Put the better archer in a box. The performance task has pupils compare the performance of two archers using box-and-whisker plots. The resource includes sample responses that are useful in comparing individuals' work to others.
EngageNY
Another Computational Model of Solving a Linear System
The process of elimination really works! Use elimination when substitution isn't doing the job. The 29th segment in a series of 33 introduces the elimination method to solving linear systems. Pupils work several exercises to grasp the...
EngageNY
Describing the Center of a Distribution
So the mean is not always the best center? By working through this exploratory activity, the class comes to realize that depending upon the shape of a distribution, different centers should be chosen. Learners continue to explore...
EngageNY
Analyzing a Graph
Collaborative groups utilize their knowledge of parent functions and transformations to determine the equations associated with graphs. The graph is then related to the scenario it represents.
Curated OER
Candy Machine
Using the concept of a candy vending machine, young mathematicians explore the sugar ratios found in different types of candy. Using the provided information, class members calculate and compare different ratios in...
Mathematics Vision Project
Module 6: Congruence, Construction, and Proof
Trace the links between a variety of math concepts in this far-reaching unit. Ideas that seem very different on the outset (like the distance formula and rigid transformations) come together in very natural and logical ways. This...
EngageNY
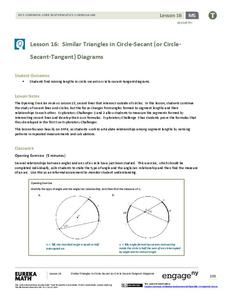
Similar Triangles in Circle-Secant (or Circle-Secant-Tangent) Diagrams
First angle measures, now segment lengths. High schoolers first measure segments formed by secants that intersect interior to a circle, secants that intersect exterior to a circle, and a secant and a tangent that intersect exterior to a...
West Contra Costa Unified School District
Correlation and Line of Best Fit
Computers are useful for more than just surfing the Internet. Pupils first investigate scatter plots and estimate correlation coefficients. Next, they use Microsoft Excel to create scatter plots and determine correlation...
EngageNY
Systems of Equations Leading to Pythagorean Triples
Find Pythagorean Triples like the ancient Babylonians. The resource presents the concept of Pythagorean Triples. It provides the system of equations the Babylonians used to calculate Pythagorean Triples more than 4,000 years ago. Pupils...
EngageNY
Changing the Base
I can't calculate a base-2 logarithm since my calculator doesn't have a base-2 log key. Young mathematicians use the change of base formula to extend the properties of logarithms to all bases. Among these bases is the natural log base,...
EngageNY
Using Sample Data to Compare the Means of Two or More Populations II
The 23rd segment in a series of 25 presents random samples from two populations to determine whether there is a difference. Groups determine whether they believe there is a difference between the two populations and later use an...
Mathematics Vision Project
Geometric Figures
Logical thinking is at the forefront of this jam-packed lesson, with young mathematicians not only investigating geometric concepts but also how they "know what they know". Through each activity and worksheet, learners wrestle with...
EngageNY
Secant Lines; Secant Lines That Meet Inside a Circle
Young mathematicians identify different cases of intersecting secant lines. They then investigate the case where secant lines meet inside a circle.
EngageNY
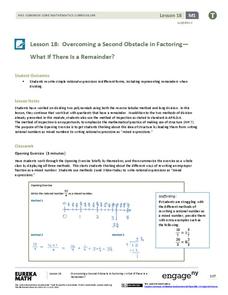
Overcoming a Second Obstacle in Factoring—What If There Is a Remainder?
Looking for an alternative approach to long division? Show your classes how to use factoring in place of long division. Increase their fluency with factoring at the same time!


