EngageNY
Translations
Learn through constructions! Learners examine a translation using constructions and define the translation using a vector. Pupils then construct parallel lines to determine the location of a translated image and use the vector as a guide.
EngageNY
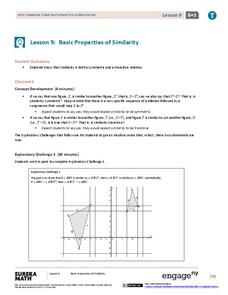
Basic Properties of Similarity
Does the symmetry and transitive property apply to similarity? The 10th segment in a series of 16 presents the class with a group of explorations. The explorations have pairs show that similarity is both symmetrical and transitive. It...
EngageNY
Problem Solving When the Percent Changes
Use more than one whole to solve percent problems. The ninth installment in a 20-part series has pupils work percent problems in which they must determine two wholes. Individuals use double number lines to represent and solve the...
EngageNY
Populations, Samples, and Generalizing from a Sample to a Population
Determine the difference between a sample statistic and a population characteristic. Pupils learn about populations and samples in the 14th portion in a unit of 25. Individuals calculate information directly from populations called...
EngageNY
Random Sampling
Sample pennies to gain an understanding of their ages. The 16th installment of a 25-part series requires groups to collect samples from a jar of pennies. Pupils compare the distribution of their samples with the distribution of the...
EngageNY
Sampling Variability and the Effect of Sample Size
The 19th installment in a 25-part series builds upon the sampling from the previous unit and takes a larger sample. Pupils compare the dot plots of sample means using two different sample sizes to find which one has the better variability.
EngageNY
Estimating a Population Proportion
Find the percent of middle schoolers who want the ability to freeze time. The 21st installment in a series of 25 has groups collect a random sample of respondents who answer a question about superpowers. Using sample statistics,...
EngageNY
Writing and Evaluating Expressions—Multiplication and Division
Don't table the resource on writing expressions for relationships in tables. Scholars investigate relationships between variables and write algebraic expressions involving multiplication and division. These expressions help solve...
EngageNY
Connecting Graphical Representations and Numerical Summaries
Which graph belongs to which summary statistics? Class members build upon their knowledge of data displays and numerical summaries to connect the two. Pupils make connections between different graphical displays of the same data in the...
EngageNY
Describing Center, Variability, and Shape of a Data Distribution from a Graphical Representation
What is the typical length of a yellow perch? Pupils analyze a histogram of lengths for a sample of yellow perch from the Great Lakes. They determine which measures of center and variability are best to use based upon the shape of the...
EngageNY
Find Solutions to Make Equations True
The truth is always best. Individuals continue to find values that make equations true in the 26th installment of the 36-part module. The only difference is that they now call them solutions to those equations.
Teach Engineering
How Big? Necessary Area and Volume for Shelter
Teams must determine the size of cavern needed to house the citizens of Alabraska to protect them from the asteroid impact. Using scaling properties, teams first determining the number of people that could sleep in a classroom and then...
EngageNY
Using Expected Values to Compare Strategies
Discover how mathematics can be useful in comparing strategies. Scholars develop probability distributions for situations and calculate expected value. They use their results to identify the best strategy for the situation.
EngageNY
Fundamental Theorem of Similarity (FTS)
How do dilated line segments relate? Lead the class in an activity to determine the relationship between line segments and their dilated images. In the fourth section in a unit of 16, pupils discover the dilated line segments are...
EngageNY
Determining the Equation of a Line Fit to Data
What makes a good best-fit line? In the 10th part of a 16-part module, scholars learn how to analyze trend lines to choose the best fit, and to write equations for best-fit lines to make predictions.
EngageNY
Geometric Interpretations of the Solutions of a Linear System
An intersection is more than just the point where lines intersect; explain this and the meaning of the intersection to your class. The 26th segment in a 33-part series uses graphing to solve systems of equations. Pupils graph linear...
EngageNY
The Computation of the Slope of a Non-Vertical Line
Determine the slope when the unit rate is difficult to see. The 17th part of a 33-part series presents a situation that calls for a method to calculate the slope for any two points. It provides examples when the slope is hard to...
EngageNY
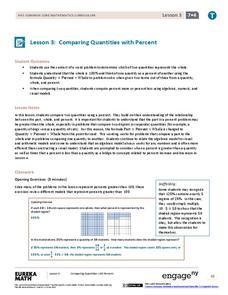
Comparing Quantities with Percent
Be 100 percent confident who has the most and by how much. Pupils use percentages to help make the comparisons by finding what percent one quantity is of the other. They also determine the percent differences between the two quantities.
EngageNY
Percent Error Problems
Individuals measure a computer monitor and determine how accurate their measures are. The eighth segment in a series of 20 introduces the concept of percent error. Pupils find the percent error of their measurements and discuss the...
EngageNY
Solving Problems by Finding Equivalent Ratios II
Changing ratios make for interesting problems. Pupils solve problems that involve ratios between two quantities that change. Groups use tape diagrams to represent and solve classroom exercises and share their solutions.
EngageNY
The Structure of Ratio Tables—Additive and Multiplicative
Build tables by understanding their structure. Scholars take a closer look at the structure of ratio tables in the 10th segment in a 29-part series. Individuals realize that the tables can be built using an additive or multiplicative...
EngageNY
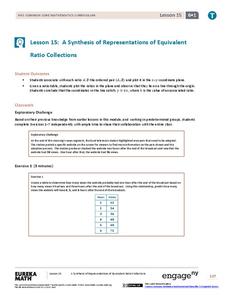
A Synthesis of Representations of Equivalent Ratio Collections
Make all the ratio representations fit together. The 15th segment in a series of 29 presents ratio problems to solve. Scholars use a variety of representations to respond to the questions. The problem set has pupils show how the...
EngageNY
Problem Solving Using Rates, Unit Rates, and Conversions
Find a way to work with rates. The 23rd part in a 29-part series presents work problems for the class to solve given work rates. Pupils compare rates to determine which is faster. Some problems require learners to convert the rates to...
EngageNY
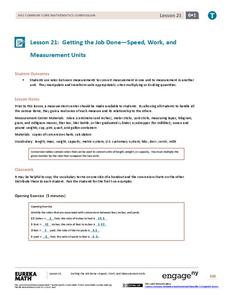
Getting the Job Done—Speed, Work, and Measurement Units
How do you convert from one measurement to another? Pupils use unit rates to convert measurements from one unit to another in the 21st segment in a 29-part series. They convert within the same system to solve length, capacity, weight,...


