Mathematics Assessment Project
Generalizing Patterns: The Difference of Two Squares
After completing an assessment task where they express numbers as the difference of squares (i.e., 9 = 5^2 – 4^2), class members note any patterns that they see in the problems.
Mathematics Assessment Project
Translating Between Repeating Decimals and Fractions
Model for your young mathematicians the process for converting repeating decimals to fractions. To demonstrate their understanding of the process, class members then complete and assessment task and participate in an activity matching...
DK Publishing
More Multiplication Practice, 1-Digit by 2-Digit Numbers
When multiplying two-digit numbers by one-digit numbers, use a guided set of problems like this one. There are three examples for young mathematicians to reference, and they solve 20 equations. They are required to regroup for some....
Curated OER
Multiples of 6 #2
Count by six with these helpful activities. After completing number sequences and multiplication problems from the six times table, third graders solve problems that are written out at the bottom of the page. An excellent way to work on...
DK Publishing
Subtraction Practice #3
Reinforce subtraction skills with twenty problems, all subtracting two-digit numbers from three-digit numbers. An additional five problems at the end of the page include decimals to the hundredth place. Great as a homework assignment or...
Statistics Education Web
Odd or Even? The Addition and Complement Principles of Probability
Odd or even—fifty-fifty chance? Pupils first conduct an experiment rolling a pair of dice to generate data in a probability lesson. It goes on to introduce mutually exclusive and non-mutually exclusive events, and how to use the...
T. Smith Publishing
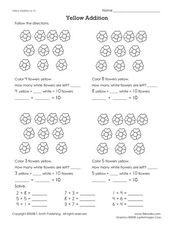
Yellow Addition
Lovely yellow flowers fill the page! Primary math masters color the given number of flowers yellow, determine how many flowers are left, and write a number sentence for the problem. Several examples of addition number sentences are...
Mathematics Assessment Project
Calculating Volumes of Compound Objects
After determining the volume of various drinking glasses , class members evaluate sample responses to the same task to identify errors in reasoning.
Curated OER
Comparing Value for Money: Baseball Jerseys
Learners step up to the plate as they first complete an assessment task using linear equations to determine the best company from which to buy baseball jerseys. They then evaluate provided sample responses identifying strengths and...
American Statistical Association
Chunk it!
Chunking information helps you remember that information longer. A hands-on activity tests this theory by having learners collect and analyze their own data. Following their conclusions, they conduct randomization simulations to...
American Statistical Association
Confidence in Salaries in Petroleum Engineering
Just how confident can we be with statistics calculated from a sample? Learners take this into account as they look at data from a sample of petroleum engineer salaries. They analyze the effect sample size has on a margin of error and...
American Statistical Association
More Confidence in Salaries in Petroleum Engineering
Making inferences isn't an exact science. Using data about salaries, learners investigate the accuracy of their inferences. Their analyses includes simulations and randomization tests as well as population means.
T. Smith Publishing
Subtracting From 10
For each row of ten animals, a certain number are crossed out as an example of subtraction. Little learners really grasp the concept as they work through the rows. The math sentence for each row is written below the graphics, and...
Curated OER
Sharpen Your Skills: Worksheet 9
This worksheet is a mix of math skills directed at fifth graders. They will compare sets of numbers that include whole numbers, decimals, and fractions to order them from smallest to largest. The page concludes with a review of...
Philadelphia Museum of Art
Physics at the Art Museum: Kinetic Energy, Potential Energy, and Work
Connect science, math, and art for a true interdisciplinary activity! Learners explore simple machines in art. Through analysis with a physics app, they identify positions of kinetic and potential energy and make conclusions about work.
American Statistical Association
Don't Spill the Beans!
Become a bean counter. Pupils use a fun activity to design and execute an experiment to determine whether they can grab more beans with their dominant hand or non-dominant hand. They use the class data to create scatter plots and then...
American Statistical Association
How Long is 30 Seconds?
Is time on your side? Pupils come up with an experiment to test whether their classmates can guess how long it takes for 30 seconds to elapse. They divide the class data into two groups, create box-and-whisker plots, and analyze the...
American Statistical Association
How Tall and How Many?
Is there a relationship between height and the number of siblings? Classmates collect data on their heights and numbers of brothers and sisters. They apply statistical methods to determine if such a relationship exists.
American Statistical Association
Exploring Geometric Probabilities with Buffon’s Coin Problem
Scholars create and perform experiments attempting to answer Buffon's Coin problem. They discover the relationships between geometry and probability, empirical and theoretical probabilities, and area of a circle and square.
Statistics Education Web
When 95% Accurate Isn’t
Investigate the effect of false positives on probability calculation with an activity that asks scholars to collect simulated data generated by a calculator. To finish, participants analyze the probability of certain outcomes which lead...
Statistics Education Web
Consuming Cola
Caffeine affects your heart rate — or does it? Learners study experimental design while conducting their own experiment. They collect heart rate data after drinking a caffeinated beverage, create a box plot, and draw conclusions....
Curated OER
Place Value for Decimals
Are your fourth graders having problems with decimals? Help them identify the place value of various numbers. Here, they describe what happens to the value of different numbers, as well as select numbers with given values in the tenths...
American Statistical Association
An A-MAZE-ING Comparison
Teach your class how to use descriptive statistics through a hands-on data collection activity. Pupils collect their own data, calculate test statistics, and interpret the results in context. They compare male and female results, looking...
American Statistical Association
Chocolicious
To understand how biased data is misleading, learners analyze survey data and graphical representations. They use that information to design their own plans to collect information on consumer thoughts about Chocolicious cereal.


