Curated OER
Human Number Line
Pupils compare different types of numbers. Each student is given a flashcard containing a decimal, percent, fraction or integer. Teams of students compete, in silence, to determine who can line up in numerical order correctly. They...
Curated OER
Integer Intro
Read a series of word problems and have your class identify the process to solve them. They practice identifying, comparing, and ordering integers. They focus on recognizing opposites and the absolute value of number. An assessment...
Curated OER
Decimals Anyone?
Seventh graders compare and order decimals. Given a set of integers, they compare them using inequalities. In groups, 7th graders participate in hands-on decimal activities. Using string, paper clips and decimal cards, classmates...
Curated OER
Fractions Continued
Pupils investigate the concept of using fractions to solve problems involving rational numbers. They order real numbers on the number line with the classification of fractions. Also students solve problems using the four operations with...
Curated OER
Elements of Chemistry: The Periodic Table
Students examine the atomic structure of elements. In this chemistry lesson students organize elements of the periodic table according to their atomic mass, and compare their order within the periodic table.
EngageNY
Interpreting the Standard Deviation
Does standard deviation work for non-symmetrical distributions, and what does it mean? Through the use of examples, high schoolers determine the standard deviation of a variety of distributions and interpret its...
Curated OER
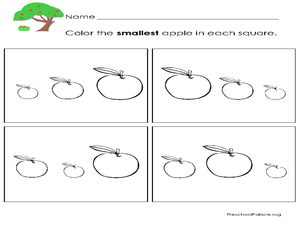
Finding the Smallest Apple
In this finding the smallest apple worksheet, students look at the pictures in four boxes, then color the smallest apple in each one.
Curated OER
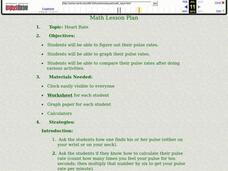
Graphing Heart Rates
Students take their pulse rates. In this graphing lesson, students take their pulse rates and graph them. Students do various physical activities and graph the differences in their pulse rates.
Curated OER
Harcourt Story: Eleanor and Amelia Go for a Ride
Fourth graders are introduced to a list of vocabulary words as it relates to the story Eleanor and Amelia Go for a Ride and a use graphic organizer to clarify the meaning of the text. For this "Eleanor and Amelia Go for a Ride"...
Curated OER
Too Many Tens
Students practice grouping in different ways by putting numbers up to 1,000 in the correct place value. In this place value lesson plan, students estimate items in a jar and then count them out by grouping them by 10s.
Curated OER
Learn How to Graph
Students examine various types of charts and discover how to construct a line graph. Using graph paper, they construct a graph displaying weight loss over a five-year period. They draw copnclusions from the completed graphs.
Curated OER
Who Has More?
Learners engage in a lesson that is concerned with the standard of comparing the quantities of whole numbers using different strategies from the concrete to the abstract. They count objects and compare them, use symbols of comparison,...
Curated OER
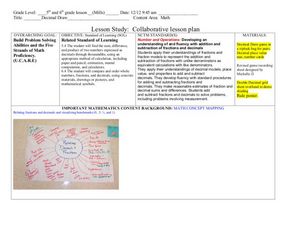
Decimals: Collaborative Lesson
Students explore mathematics by participating in a group activity. In this number value lesson, students identify the uses for decimals and how to best estimate whole numbers based on decimals and fractions. Students collaborate with...
Alabama Learning Exchange
The World of Integers
Review operations related to rational numbers and integers using the include PowerPoint presentation, "Interesting Integers." Young mathematicians classify rational numbers as being natural, whole, or integers and read an article about...
Curated OER
Earth in the Solar System
A three-week unit designed to be completed in an elementary level, dual-language immersion classroom, this resource includes several lessons intended to introduce young learners to the solar system, the Earth and how the Earth compares...
Neufeld Learning Systems
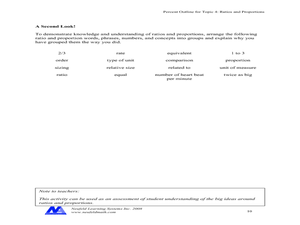
Concept: Ratios and Proportions
Upper elementary and middle school pupils fill out a chart creating six equivalent fractions and then compare them to six different objects and/or shapes. They group together 16 various terms related to ratios and proportions. Pupils...
Virginia Department of Education
Analyzing and Interpreting Statistics
Use measures of variance to compare and analyze data sets. Pupils match histograms of data sets to their respective statistical measures. They then use calculated statistics to further analyze groups of data and use the results to make...
Pennsylvania Department of Education
What is the Chance?
Fourth and fifth graders make predictions using data. In this analyzing data lesson plan, pupils use experimental data, frequency tables, and line plots to look for patterns in the data in order to determine chance. You will need to make...
Curated OER
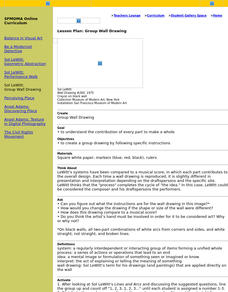
Group Wall Drawing
Students create a group wall drawing that demonstrate the contributions that each part makes to the whole.
Curated OER
Build a Bar Graph
Learners discover how to use bar graphs. They will gather and organize specific data in order to put it into a bar graph. Then they will answer several questions based on the information they have graphed.
Illustrative Mathematics
The Florist Shop
A real-world approach to common multiples asks learners to find different groups of flowers based on their multiples. Useable as a class activity or independent exercise, they will have to organize their thoughts to explain the totals of...
Virginia Department of Education
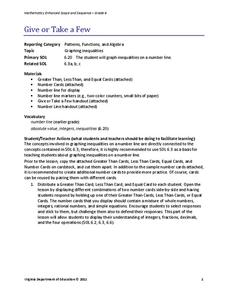
Give or Take a Few
Young mathematicians extend their knowledge of rational numbers on a number line to graph inequalities by first using number cards to compare rational numbers. They finish by using similar reasoning to graph inequalities on a number line.
Curated OER
Exponential Growth versus Polynomial Growth
Your algebra learners explore the values of two types of functions in order to compare growth rates in this short cooperative task. Two types of solutions are given, using a table of values and an abstract argument.
Utah Education Network (UEN)
The Pasture and the Fence
Beginning geometers use tiles and grid paper to draw and calculate perimeter and area. Rectangles of different sizes are created and then measured to build understanding. The one-inch grid sheet referenced is attached.


