Curated OER
Soil Structure
Sixth graders examine how different soils are made up of varying proportions of clay, silt, and sand. They compare soil samples, conduct Internet research, and create a model to demonstrate the relative sizes of grains of clay, sand, and...
Curated OER
Exploring Virtual Europe
Students research the geography, government, climate, history, economy, and culture of a European country. They select a country in Europe, explore various websites, and complete a worksheet.
Curated OER
Trends of Snow Cover and Temperature in Alaska
Students compare NASA satellite data observations with student surface measurements of snow cover and temperature. They practice data collection, data correlations, and making scientific predictions.
Curated OER
Creating a Website on Explorers
Students identify and research famous European explorers using a variety of sources. They compare and contrast the explorers drawing conlusions about the importance of each explorer. They design a web page on one explorer of their choice.
Curated OER
Celebrate The Four Seasons
Students investigate cause and effect and compare and contrast how recurring cycles are evident in multiple aspects of their education. They answer questions in the chosen field. Students model each aspect by interpreting, perceiving and...
Curated OER
The Twelve Months: A Slavic Cinderella Variant
Students locate Slavic countries and identify a few characteristics of those countries. They read and/or listen to the Slavic tale, "The Twelve Months," and compare this version with another Cinderella story.
Curated OER
The Rifting of Pangaea and the Gettysburg Battlefield
Eleventh graders analyze and interpret an animated model of Earth’s rifting processes. In this Earth Science lesson, 11th graders connect Earth’s rifting processes with the Earth’s surface in the Gettysburg battlefield. ...
Curated OER
Trouble in the Troposphere
Pupils create graphs using NASA data, compare ozone levels of several U.S. cities, analyze and evaluate the data and predict trends based on the data, and discuss and describe how human activities have modified Earth's air quality.
Curated OER
Trouble in the Troposphere
Students Use data sets from MY NASA DATA to produce graphs comparing monthly and yearly ozone averages of several U.S. cities. They analyze and evaluate the data and predict trends based on the data. In addition, they discuss and...
Curated OER
Cultures Around the World
Students research, using the Internet, cultures of the world. They identify countries, their currency, holidays, climate and societal information. They look at the distance of international cities from their hometown.
Curated OER
Homes Around the World
Students investigate houses and homes from around the world and create a map collage. They compare how the homes are similar and different and why houses match the weather and geography.
Curated OER
Ecoregions of Texas
Seventh graders discuss why hunter-gatherers might have favored certain areas in which to live. In pairs, they research specific regions to examine in depth. Students present their eco-region vegetation findings (in this case Central...
Curated OER
Beautiful Bovine
Students compare and contrast a human body to a cow. Using a diagram, they label and identify the functions of the cow's numerous parts. In groups, they create a Venn Diagram to compare the various types of cows with one another. They...
Curated OER
Turin, Geography, Culture And Sports
Learners study why certain locations are suitable to host the Winter Olympics. They research the characteristics of Turin, Italy, plan a trip and create a multimedia scrapbook of the trip.
Curated OER
What Living Things Need
Young scholars apply the process of scientific inquiry to explore how living things are dependent on one another for survival. They match animals with their generalized food source. Students predict what happens to the organisms when...
Curated OER
How Animals Prepare for the Winter
Students study animals. For this hibernation lesson, students are read Stranger in the Woods and they discuss what various animals do in their habitat during the winter. They work as a class to create their own hibernation environment...
Curated OER
It's So Sticky Outside That...
Middle schoolers examine the phases of the water cycle and water's different forms it can have. They work in groups to create pantomimes to illustrate the water cycle to their classmates.
Curated OER
How the Environment Effects our Feelings
First graders compare images and discuss their feelings created by an artist's work. They explore the correlation between experiencing feelings in art and literature and feelings caused by changes in weather.
Curated OER
Geography of Korea
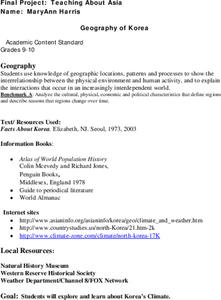
Students are introduced to the geography of Korea. Using the internet, they identify the weather and climate in the country and create a week weather chart for Korea's four seasons. They complete an interview with a local weatherman...
Curated OER
A Comparison of Land and Water Temperature
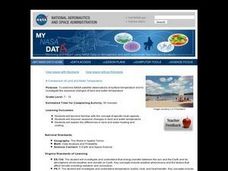
Students use the NASA website's Live Access Server to create a graph of surface temperature at two locations on earth. They analyze the data and then answer specific questions provided in this lesson. They also examine and compare the...
Curated OER
Science: Trouble in the Troposphere
Students research a NASA Website and record information about an assigned city's tropospheric ozone residual monthly climate. In groups, they graph the information for the past year. They form new groups and compare their city's...
Curated OER
"Across Oregon On The 45th N Parallel" A Transect of Oregon
Young scholars explore the physical geography of Oregon. In groups, students collect weather and elevation information on Oregon. They organize the data and create maps and graphs of the information. Afterward, young scholars compare the...
Curated OER
Agriculture
Young scholars examine the types of agriculture in their own state and in their local community. They examine how food makes it to their local grocery store. They compare data from different states.
Curated OER
Predicting Monthly Precipitation
Students should log onto, and collect data from, a specific site on the Internet. They average and compare the data using the Excel spreadsheet program, make predictions from their data, and determine the percent error of their predictions.


