Curated OER
Fractions of a Sheet Cake
Second graders become familiar with the fractions in a whole. For this sheet cake lesson, 2nd graders view a Count on it clip about pumpkin pies. Students cut a sheet cake into eight parts and write as a fraction. Students understand...
Curated OER
Temperature
Students understand that temperatures in Alaska can be negative numbers. In this temperature instructional activity, students recognize the temperatures above and below zero. Students compare temperatures using the greater than and less...
Curated OER
Random Sampling
In this random sampling worksheet, students compare data collected by a random sample to data collected by an actual count using pieces of paper with numbers written on them. They compare their data for the actual count to the random...
Curated OER
Fraction Conversion 2 (With Percents)
Fifth graders determine how to convert fractions, decimals, and percents. In this conversion lesson plan, 5th graders use an on-line applet to practice making these conversions. They review how to make the conversions in a whole class...
Pennsylvania Department of Education
Multiplication Represented as Arrays
Third graders collect data about themselves and use in a line plot. In this analyzing data lesson, 3rd graders collect various sets of information,create a line plot and compare the data. Students complete a worksheet on their results.
Curated OER
Moooving to Low-fat Milk
Third graders complete two handouts. In this healthy beverages lesson plan, 3rd graders compare whole, two percent and skim milks. Students use labels to help choose healthy beverages. Students complete an "All About Milk" and...
Curated OER
Geoboard Squares
Students create squares of different sizes on a geoboard. They find and describe a pattern. Students use the pattern to determine the number of squares possible on a 10-by-10 geoboard. They create squares with a horizontal base (and...
Curated OER
2.0 "Water Is Life" Global Water Awareness Mini-Unit (Grades3-5)
Students study the amount of potable water on the Earth. In this water lesson, students examine the amount of potable water as compared to all the water on the Earth. They discuss why many parts of the world do not have access to good...
Curated OER
Invitation To Integers
Students find zero pairs and add integers using zero pairs and a number line. They generalize rules for adding integers. The class view approximately 10 minutes of video divided into three segments.
Curated OER
A Biblical Perspective
Students analyze money using a Biblical and business perspective. In this algebra lesson, students define their money relationship biblically and in a business fashion. They compare their view with the view of someone in the Gold Rush days.
Curated OER
Data Analysis and Probability
Students make their own puzzle grid that illustrates the number of sit-ups students in a gym class did in one minute, then they make a histogram for this same data. Then they title their graph and label the scales and axes and graph the...
Curated OER
Kindergarten Exploration Tubs
Students identify their names as a symbol for themselves. They describe characteristics of organisms. They utilize tools to gather data and compare size.
Curated OER
Roles of Virginians During Revolutionary War Era
Learners examine the various roles Virginians played during the Revolutionary War era. They participate in a jigsaw activity, reading an article and presenting information to their group. Students then complete a Venn diagram comparing...
Curated OER
Apple Estimation: Percentages & Subjective Reasoning
Students practice using their estimation skills by utilizing apples. In this percentage lesson plan, students utilize a scale and an apple to discover the percentage of each bite they take. Students share their data with the rest of...
Pennsylvania Department of Education
Use Order of Operations to Evaluate Expressions—No Grouping Symbols
Students identify and explain different types of data collection and graphs. In this graphs and data collection lesson, students record their observations of a variety of data collection tools and graphs displayed in the room. Students...
Curated OER
New: Fun with Fractions
Third graders determine that the larger the denominator the more parts the whole is being divided into. They use fractions to communicate and compare parts of the whole. They discover what the numerator and denominator of a fraction...
Curated OER
WHY YOU SHOULD LISTEN TO YOUR GRANNY
Students hear a story and use a graphic organizer to identify problems and solutions. They also identify main characters, setting and simple plot. They illustrate one situation when they should listen to their parents.
Curated OER
Pocket Change
Students practice identifying coins and their values. In this money identification lesson, students play a game, where they toll a coin, determine the value, and compare totals to win.
Curated OER
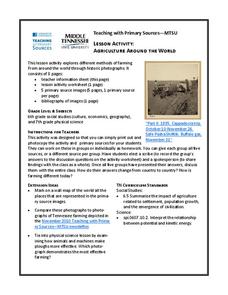
Agriculture Around the World
Young scholars explore various kinds of farming methods around the world. In this history lesson, students view pictures of farming methods, then compare and contrast them in a class discussion with the methods of farming that are used...
Curated OER
Object Graphs
Students identify geometric shapes, demonstrate construction of an object graph, compare sets of objects, estimate which student has the most geometric shapes in his or her bag, and play computer game Jump Start Kindergarten.
Curated OER
Get Ready, Get Set, Hibernate
Students match each body part or idea from a work bank about methods of animal adaptations for winter survival. They observe as the first one, food is covered with the whole class before completing the rest of the diagram. They discuss...
Curated OER
Measuring Inches
First graders measure the length of pipe cleaners to form worms using rulers to focus on inches. They record their results and graph the measurement of each pipe cleaner. They measure their pipe cleaner "worms" in various colors and...
Curated OER
Inflation
Learners compare prices then and now. They use the calculated rate of inflation to figure out the equivalent prices today for items sold at the fair and money earned in 1864. They calculate the actual value of a bowl of soup, a dinner,...
Curated OER
Economic Recovery? a Comparison of Indicators for Utah And the United States Since March 2001
Students discuss key business and consumer indicators that are used to measure the health of the economy. They compare the economic recovery (from the 2001 recession) of Utah and the United States. They discuss the benefits and...


