Curated OER
Catcher in the Rye: Chapters 18-20 Venn Diagram
Well into Catcher in the Rye, when things are looking bleak and your readers may be needing some levity, read the picture book The Perfect Square by Michael Hall. Then use the Venn diagram included to compare how Holden Caulfield and the...
Virginia Department of Education
Analyzing and Interpreting Statistics
Use measures of variance to compare and analyze data sets. Pupils match histograms of data sets to their respective statistical measures. They then use calculated statistics to further analyze groups of data and use the results to make...
EngageNY
Displaying a Data Distribution
Pupils analyze a display of data and review dot plots to make general observations about the highest, lowest, common, and the center of the data. To finish, learners match dot plots to scenarios.
Northeastern Educational Television of Ohio, Inc.
Roman World vs. Feudal World
Young historians compare the major features of the Roman and feudal worlds, such as religion, social hierarchy, and political tenets, using online resources and group discussion.
Inside Mathematics
Printing Tickets
Determine the better deal. Pupils write the equation for the cost of printing tickets from different printers. They compare the costs graphically and algebraicaly to determine which printer has the best deal based upon the quantity of...
Science Matters
Richter Scale
The 12th lesson in a series of 20 opens with a demonstration of exponential functions using pasta. This concept is connected to the Richter Scale, which is also an exponential function. Scholars compare the exponential scale that...
Mathematics Vision Project
Module 2: Systems of Equations and Inequalities
The brother-sister pair Carlos and Clarita need your class's help in developing their new pet sitting business. Through a variety of scenarios and concerns presented to the siblings, the learners thoroughly explore systems of equations...
Science Matters
Earthquake Building/Shaking Contest
Japan is one of only a handful of countries that constructs buildings that are almost earthquake proof. The 13th lesson in the 20-part series challenges scholars to build structures to test against earthquakes. With limited materials and...
EngageNY
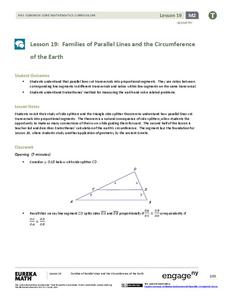
Families of Parallel Lines and the Circumference of the Earth
How do you fit a tape measure around the Earth? No need if you know a little geometry! Pupils begin by extending their understanding of the Side Splitter Theorem to a transversal cut by parallel lines. Once they identify the proportional...
Concord Consortium
Acid Test
This isn't your typical basic lesson—it's more acidic! Learners use pH information to determine the hydroxide ion concentration of different substances and then use these values to analyze information. The calculations require...
Curated OER
Ice Cream Numbers: Worksheet A
In this number learning exercise, students color the scoop of ice cream that has the largest number, then the scoop that has the smallest number. Students then write the number that comes between 2 others. Numbers are all on scoops of...
Curated OER
Smallest to Largest: Decimals to the Tenths Place
Dealing with decimals in your fourth grade class? Make them easy to understand with a straightforward worksheet, which instructs youngsters to put groups of decimals in order from smallest to largest. A great way to review place value...
Laboratory for Atmospheric and Space Physics
The Planets and Scale
Scholars gain an insight into the relative size of planets and distance between inner and outer planets with the help of informational text, a data table, and a series of four questions.
Illustrative Mathematics
Valid Equalities?
True or false: 20 = 10 + 10. The statement is true because two 10s make a 20. These are the types of equations learners must label or false. They must also explain in mathematical terms how they know.
Curated OER
Order Numbers from Least to Greatest
In this math worksheet, students compare 6 one and two digit numbers in a set and put them in order from least to greatest. There are 24 sets on the page.
Curated OER
Comparing Numbers
In this math activity, students compare the numbers by listing the symbol of <> or =. The answers are for the ten problems is found on page 2.
Curated OER
Counting Chart
Elementary learners discover counting through a counting chart. In this math lesson plan, students identify numbers 1-100. They then point or recite their counting numbers.
Curated OER
Introduction to Visualization
Fourth graders listen to The Bear's Toothache and illustrate the story in their minds. In this visualization lesson, 4th graders draw pictures of what they hear in a read aloud. Students discuss their pictures and compare and contrast...
Curated OER
Taking Attendance
Young mathematicians record and analyze data. They will take attendance for their class and compare to other days. Then discuss ways to count who is present. They may also show the amount of learners present using fractions.
Computer Science Unplugged
Conversations with Computers—The Turing Test
Will the real computer please stand up? The premise of this activity is for the class to ask questions to a human and to a computer and to determine which is which. The class asks a given set of questions, and the person playing the role...
SEN Teacher
Dice Printer
Let the dice decide your fate with this custom site that creates a die printable based on your needs. Pick from different sizes and custom label each face to use for fun activities.
Curated OER
Hand Span and Height
Is there a relationship between hand span width and height? Statisticians survey each other by taking measurements of both. A table that can hold data for 24 individuals is printed onto the worksheet, along with questions for analysis....
Curated OER
Comparatives and Prices
Young scholars review the vocabulary and write the comparative form of the word. They use vocabulary from flyers from stores in the area. They take an exam over the material.
Curated OER
Compare and Order Fractions and Mixed Numbers
In this comparing and ordering fractions and mixed numbers practice worksheet, students sharpen their problem solving skills as they solve 6 story problems.


