Curated OER
A Nice Story
Explore word choice in writing. Your class listens to a short story entitled "A Nice Day" (included) and discusses how the story could be improved. Pupils replace the word nice throughout the story with various synonyms, then reread the...
Curated OER
Credible Sources on the Internet: What to Trust, What to Dismiss and When to Cite a Source
Wait, you mean researchers don't all use Wikipedia? Teach your class about intelligent research with a lesson about evaluating digital sources. The lesson starts with a quickwrite and includes vocabulary exercises and several...
Rochester Institute of Technology
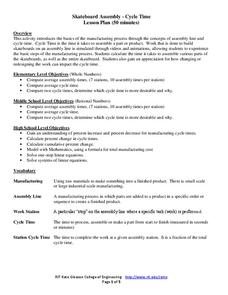
Skateboard Assembly - Cycle Time
Assemble a great activity on assembly lines. In the first installment of a nine-part technology/engineering series, future entrepreneurs learn about the manufacturing process, specifically about the assembly line and cycle time. The...
02 x 02 Worksheets
Inverse Variation
Discover an inverse variation pattern. A simple lesson plan design allows learners to explore a nonlinear pattern. Scholars analyze a distance, speed, and time relationship through tables and graphs. Eventually, they write an equation to...
Curated OER
The Greedy Dog
Teach young mathematicians the concepts of greater than, less than, and equal to with kinesthetic, visual, verbal, and numeric approaches. In a playful session that addresses multiple intelligences, your class will: dramatize a greedy...
Curated OER
Addition and Subtraction of Fractions
Students demonstrate how to solve addition and subtraction of fractions. In this fractions lesson, students use folded paper to shade in fractional parts and identify the sum of the parts shaded.
NY Learns
Investigation - Looking at Polygons
Middle schoolers construct polygons by plotting points on a coordinate plane. Pupils connect the points and identify which polygons they have drawn. They will need graph paper to carry out the assigned activities. A vocabulary list,...
Curated OER
Cyber Chow Combos
Using a worksheet that's embedded in the plan, elementary schoolers must come up with the most possible combinations of food they can order from the menu on the worksheet. The lesson is meant to be done independently by everyone, then...
Curated OER
Defining Division
Upper graders explore division through fair-shares. They will review fair shares and fractions as a segway into division. They start by playing "Share Fairly" game and create mathematical arguments for solving problems. Manipulatives and...
Illustrative Mathematics
Puzzle Times
Give your mathematicians this set of data and have them create a dot plot, then find mean and median. They are asked to question the values of the mean and median and decide why they are not equal. Have learners write their answers or...
Mathematics Assessment Project
Modeling: Making Matchsticks
Math: The only subject where the solution to a problem is seven million matches. Young scholars first complete an assessment task estimating the number of matches they can make from a tree of given dimensions. They then evaluate provided...
Illustrative Mathematics
Find the Change
This exercise is an opportunity for algebra learners to understand the connection between the slope of a line and points found on the line. Use similar triangles to explain why slope m is the same between any two points. Discuss with the...
Safe Drinking Water Foundation
Making a Difference
After learning about the effects of water pollution, your class will discuss ways to make people in their community aware of the importance of water conservation. Then, your young environmentalists will write a letter to the local...
Federal Reserve Bank
Arts and Economics Infographic Questionnaire
How do careers in the arts contribute to America's gross domestic product? Use an informative infographic that details the economic details of careers in the core arts, including design services, performing arts, and arts education, to...
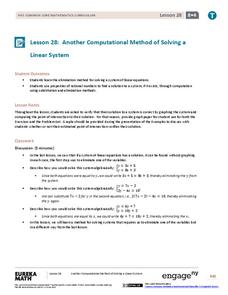
EngageNY
Another Computational Model of Solving a Linear System
The process of elimination really works! Use elimination when substitution isn't doing the job. The 29th segment in a series of 33 introduces the elimination method to solving linear systems. Pupils work several exercises to grasp the...
Curated OER
Storytelling with the Opaque Projector
Students create illustrations for a folktale that are shown with an opaque projector during the story reading. They are assigned a picture description and do not know how their picture fits into the story until all of the illustrations...
Curated OER
Yummy Math
Young mathematicians use bags of Skittles to help them gain practice in graphing and organizing data. They work in pairs, and after they have counted and organized their Skittles, they access a computer program which allows them to print...
Curated OER
Walk-A-Thon
Students graph linear http://www.lessonplanet.com/review?id=180542equations. In this problem solving lesson, students calculate slope and plot ordered pairs on a coordinate grid. Using a real-life example of a walk-a-thon, students...
University of Colorado
Space Travel Guide
Neptune takes 164.8 Earth years to travel around the sun. In the fifth of 22 lessons, young scientists create a travel guide to a planet in our solar system. They provide tips for others on what to bring, what they see, and their...
Curated OER
Measuring a Mummy Case
Learners calculate the size of a mummy case and its contents using ancient Egyptian measurements.
Curated OER
Carbondale: The Biography of a Coal Town
Students use a brief history of the growth and decline of the anthracite region in the state to create a photograph and map "peak shaped" time line. They practice map and photo analysis strategies to "read" photographs and maps.
Agriculture in the Classroom
Seed Match
Using this resource, your team of green thumbs discuss why plants are a part of a healthy diet and the different ways they are used in daily life. They then observe the characteristics of different seed as they attempt to match...
Chicago Botanic Garden
Weather or Not
What is the difference between weather and climate? This is the focus question of a activity that takes a deeper look at how weather data helps determine climate in a region. Using weather and climate cards, students decide...
Curated OER
Read My Bar Graph!
Elementary schoolers make and use bar graphs to picture information. They learn how choosing the right scale for a bar graph can help make a persuasive argument. This is a terrific lesson on graphing which should excite your kids. There...


