Curated OER
How can deep-water corals be used to determine long-term patterns of climate change?
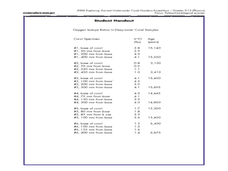
Students explore the concept of paleoclimatological proxies. In this paleoclimatological proxies lesson plan, students explain isotope ratios in deep water coral samples. Students write a paragraph about global climate change as it...
Curated OER
Climate And the Greenhouse Effect
Learners demonstrate the greenhouse effect. They recognize that relatively small changes to our environment can stimulate significant climate changes. They determine that the "scientific method" is a process of testing hypotheses and...
Curated OER
Currents and Climate
In this ocean currents worksheet, students will compare two different currents found in the Atlantic Ocean to determine how currents affect the climate in these regions. This worksheet has 3 short answer questions.
Crown Prosecution Service
Racist and Religious Hate Crime
Address the current political climate with a series of thought-provoking activities. A resource packet provides pupils with strategies for challenging racist behavior and religious prejudice, and moves them from being passive bystanders...
Curated OER
Introduction to Earth's Dynamically Changing Climate
Students identify the most common causes of global warming. In this earth science lesson, students use an interactive website to explore changes over time in sea ice, sea level, carbon emissions, and average global temperature. They take...
Curated OER
Comparing Trends in Global Temperature to Global CO2 Levels
Students examine CO2 atmospheric levels. In this atmospheric instructional activity, students examine the correlation between CO2 levels and global warming.
Curated OER
The Accuracy of Climate Data
Students use maps to determine how accurate climate data really is. They also answer questions using a table of data.
Curated OER
Climate and Periodic Functions: Science & Math Integration
High schoolers complete a lab that introduce the scientific concept of climate on Earth. Following the lab, they complete further research on climate. Using average monthly temperatures students construct a mathematical model and analyze...
Chicago Botanic Garden
Plant Phenology Data Analysis
Scientists monitor seasonal changes in plants to better understand their responses to climate change, in turn allowing them to make predictions regarding the future. The last activity in the series of six has scholars analyze BudBurst...
Curated OER
Differences Between Ground and Air Temperatures
Students examine the differences between air temperature and ground temperature. In this investigative lesson students find NASA data on the Internet and use it to create a graph.
Curated OER
El Niño ~ The Return of El Niño
El Niño sure creates a stir when it comes around! Why not stir up your earth science class with this data analysis activity that examines the temperature and precipitation over the 2002-2003 water year. A tracking chart is provided...
Polar Trec
Beacon Valley Weather
In Beacon Valley, katabatic winds regularly knock fit adults to the ground. The lesson plan compares the actual temperatures to the wind chill after factoring in katabatic winds in Beacon Valley. Scholars learn to calculate wind chill...
Curated OER
Exploring Biomes Lesson 1: Mapping Biomes
Environmental science learners examine satellite imagery of temperature, vegetation, precipitation, and productivity. They use these maps to understand how scientists divide the planet into major biomes. As part of a larger unit on...
Curated OER
The Sun: Earth's External Heat Engine - Part 1 of the Astronomy Model
Designed by School Power...NaturallySM, this lesson plan familiarizes advanced earth science and physics learners about the variables that affect our supply of solar energy. They examine gas spectra and perform calculations. There is an...
EngageNY
Variability in a Data Distribution
Scholars investigate the spread of associated data sets by comparing the data sets to determine which has a greater variability. Individuals then interpret the mean as the typical value based upon the variability.
US Department of Energy
Effects of Solar Radiation on Land and Sea
Earth science enthusiasts experiment to compare the heating rates of soil and water. They relate their findings to the weather conditions near bodies of water. Consider also having middle schoolers measure the cooling rates to...
PBS
Mountains and Rain Shadows
Scholars use an online interactive to learn just how different the other side of the mountain actually appears. They use satellite images, graphics, and videos to compare the impact of winds, oceans, clouds, precipitation, and more on...
Chicago Botanic Garden
Plant Phenology Data Analysis
Studying data over time can paint a pretty interesting picture. Learners use data they collected in the previous instructional activity to compare to historical data in a similar region. They graph the data of the first bloom of a...
NASA
Gravitational Waves
Young scientists participate in a hands-on experiment to explore Einstein's theory of relativity in a creative manner. They investigate various waves and compare their characteristics as they discuss how each wave is created. Next,...
Curated OER
Exploring Biomes Lesson 3: Endangered Biomes
Future environmental scientists compare data from two different conservation strategies. Alone this lesson is sufficient, but as part of the Exploring Biomes unit produced by the Arizona Fish and Game Department, it becomes top-notch.
Curated OER
Comparing Local, National, International Biomes
Students calculate averages of climate sets of data. In this ecology instructional activity, students analyze data to determine identity of a biome and collect meteorological data to understand process. Students also compare data sets.
Curated OER
The Search for El Nino
Sixth graders complete an El Nino scavenger hunt. In this earth science lesson plan, 6th graders describe the conditions that create El Nino and compare it to normal condition. They discuss how this phenomenon affects marine ecosystem.
Curated OER
Climate
Students make and record observations about local weather. They write about their favorite kind of weather and what it would be like to live in a climate of their choice. They take a quiz on regional U.S. climates.
National Wildlife Federation
Summer Midnight Sun
Sunlight hours and climate have a clear connection. Young researchers collect data about the sunrise and sunset times in an Arctic climate as well as the average temperatures. They then graph their data to make connections between the...


