Curated OER
Statistics and Shopping
Students examine statistics and data analysis concepts from the practical questions that arise in everyday life.
Curated OER
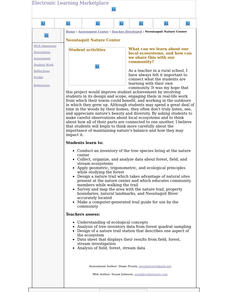
Neotaquit Nature Center: Ecosystems, Science, Technology
Students survey their local forest conducting an inventory of tree species and analyzing data of local ecosystems. They design a nature trail, map the area and make a computer generated trail guide.
Curated OER
The Household Environment Survey
Students examine data collected from a national survey of household environmental practices to develop their own questionaires. Once they have their own survey questions, students conduct their own investigations, and report their findings.
Curated OER
How is Your Driver Doing?
Sixth graders explore the concept of averaging of numbers and the function of a spreadsheet. Data is collected, analyzed, and displayed in this lesson. The NASCAR race results provides the basis for the collection of data.
Curated OER
Project School
Students investigate different people, places and items throughout the school. They examine different places and discuss their uses. They collect the data and others can interpret it as they choose.
Curated OER
Discovering a Law of Space Physics
Learners use data collected by an astronomer to determine the relationship between the time it takes the planet to orbit the sun and the average radius of the planet's orbit around the sun. Students use trial and error to find the...
Curated OER
What is the Problem of Boston Harbor?
Pupils recognize the affects of technology on the environment. They examine data to determine methods to improve waater quality. A research paper is written to desribe recommendations for improving water in the future.
Curated OER
Count On Us: Concepts and Applications of Demography
Eighth graders use the Internet to research demographics of certain areas. They use the U.S. Census Bureau's website to help them gather information. They use their data to find a solution to a hypothetical problem.
Curated OER
Make Your Own "Weather" Map
High schoolers create their own "weather" map using data from x-ray sources. They analyze and discuss why it is important to organize data in a fashion in which is easy to read. They compare and contrast different x-ray sources using a...
Curated OER
Math Can Be Mean!
Fifth graders are introduced to the topic of means. Calculating the mean, mode and median, they describe what each set of numbers tell and do not tell about the data. They use a line graph to practice finding the mean. They also use...
Curated OER
Texas Weather Report
Students use provided links to observe selected weather sites and collect temperature and precipitation data for listed cities. They enter the information onto their spreadsheet. Students study maps of the Texas natural reagions,...
Curated OER
Twelve Days of Christmas
Learners create charts and graphs using a spreadsheet. They chart the number of each gift given day by day from the song, "The Twelve Days of Christmas." They create a bar graph and a circle graph from their data on the spreadsheet.
Curated OER
Spreadsheets - WP9/Quattro Pro
Students discover spreadsheet applications using Quattro Pro. They demonstrate basic knowledge and application of hardware, software, and Internet use. They recognize and appreciate the value of recording keeping, data input and data...
Curated OER
Air in Soil Administration Procedures
Students study soil and its composition. In this soil composition lesson, students study examples of soil during several days of aeration. Students summarize their data, organize it, and must be able to explain their findings.
Curated OER
Laura Ingalls Wilder Author Study
Fifth graders explore use of computers. They use technology tools to collect, analyze and display data. Students create and format a document using word processing. They participate in a curriculum-based telecommunications project.
Curated OER
Parched! No Water, No Town
Young scholars discuss the benefits of water conservation. Given a data sheet, they document their water usage over a specified period. Water usage data is graphed and analyzed. Students discuss ways in which they can conserve water.
Curated OER
Lift vs. Airspeed
Young scholars, after reading the explanation given below, use FoilSim and a graphing calculator to complete the activity to determine the relationship between airspeed and lift of an object by interpreting data.
Curated OER
The Tale of Scale
Eighth graders, using a range of data, produce three bar graphs for various scales along the y-axis.
Curated OER
What Does Average Look Like?
Fifth graders, in groups, study the concepts of range, median, mode, and mean through the use of graphs drawn from models. They use manipulatives to represent data that they have collected within groups.
Curated OER
Mapping My Community
Ninth graders are introduced to GPS technology. They complete fieldwork as they visit a specific area of their community to identify and map types of land use in the surveyed area. They use the collected data to create a digital map.
Curated OER
Rainforest Deforestation and the Water Cycle
Students create terrariums (mini rainforests). They observe and discuss the life processes that occur in their terrariums and how changes in these processes affect the plants and organisms inside. They collect and graph data and present...
Curated OER
What is a Cloud
Third graders study clouds and how they are formed. They write acrostic poems about clouds and analyze and graph temperature data collected during varying degrees of cloud cover.
Curated OER
Reaching New Heights
Students explore the relationship between two variables. Students measure their arm span and height. They gather this class data to design a scatter plot. Students interpret the meaning of individual coordinates and the overall graph....


