Curated OER
Adding Fractions With Like Denominators
Learners investigate the concept of adding fractions with like denominators. They review how to combine the numerators. Students use cutouts to handle fractions that are hands on while comparing them to slices of pizza. They work...
Curated OER
Handling Data: Comparing Distributions
Young scholars gather information by analyzing graphs, diagrams and pie charts. In this graphs and diagrams lesson, students complete addition and subtraction problems. Young scholars discuss a pie chart. Students use information to...
Curated OER
Comparing Fractions
Third graders observe two fractions and write the numbers in order from least to greatest referring to the sheet with different fractions they have before them to help them decide which one is smaller. Time allowing, they practice...
Curated OER
Pizza Fractions
First graders identify a whole and the fractions 1/4, 1/2, and 3/4 using pizza. This is a very nice lesson, in that not only do students practice their fractions, they also get to eat the pizza at the end of the lesson!
Mathed Up!
Ordering Fractions, Decimals, and Percentages
Give scholars the opportunity to show what they know about ordering fractions, decimals, and percents with a five-page, eight-problem independent practice. With clear instructions and supportive advice, learners are bound for a...
Curated OER
Geometrically Artistic/Artistically Geomtric
Students identify the two-dimensional geometric shapes Lowrey utilized in the painting Untitled. Students compare the two-dimensional shapes in terms of equivalent fractions, congruency, symmetry and asymmetry. Students create their own...
Curated OER
Delicious Diagrams
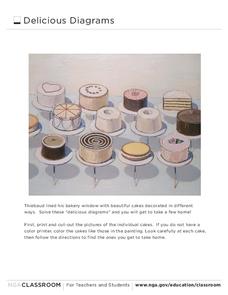
In this math instructional activity, students cut out pictures of twelve different cakes. Students use the pictures to complete four venn diagrams- half of them that compare two characteristics and the other that compare three.
Curated OER
Fractions of a Sheet Cake
Second graders become familiar with the fractions in a whole. In this sheet cake lesson, 2nd graders view a Count on it clip about pumpkin pies. Students cut a sheet cake into eight parts and write as a fraction. Students understand...
Curated OER
Fractions
Fourth graders explore the meaning of equivalent fractions, find equivalent fractions, and explain why the fractions are equal. They share their ideas about equivalent fractions. Students answer the question: "What makes equivalent...
Curated OER
The Structure of the Periodic Table
Students investigate the periodic table, the structure of the atom and the subatomic particles. In this periodic table lesson plan, students complete 5 activities in order to better understand atoms and the periodic table. They use...
Curated OER
Aboriginal Statistics
Fourth graders analyze statistics of Native Americans by creating graphs. For this data analysis lesson, 4th graders define different statistical terms and practice finding those statistics from groups of numerical information about...
Curated OER
Chromatography Lab
Students discover the components of primary and secondary colors. In this physical science lesson, students create a set up in which water will separate a color into the component colors along a piece of filter paper. Students will then...
Curated OER
Celebrate Hispanic Heritage Month!
Students use information from the U.S. Bureau of the Census to create a bar graph, a picture graph, or a circle graph showing the country of origin of U.S. Hispanics.
Curated OER
Concentration vs. Solubility
Students investigate the concentrations of solutions and solubility. In this concentrations and solubility lesson plan, students compare solutions of talcum powder in water and salt in water to have a visual of solubility. They perform...
Curated OER
Reading About Children in Other Communities
Students read about children from other communities. They describe ways in which members of other communities meet one another's needs and design a Venn diagram that compares and contrasts their own way of living to another culture.
EngageNY
The Angle Measure of an Arc
How do you find the measure of an arc? Learners first review relationships between central and inscribed angles. They then investigate the relationship between these angles and their intercepted arcs to extend the Inscribed Angle Theorem...
West Contra Costa Unified School District
Conics Introduction and Parabolas
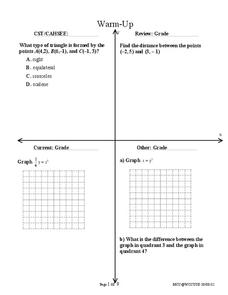
Where did conic sections get their name? The equation and graph of a parabola are developed from the definition of the conic section. Teacher examples on graphing the equation and writing an equation from the graph round out the plan.
EngageNY
Average Rate of Change
Learners consider the rate of filling a cone in the 23rd installment of this lesson series. They analyze the volume of the cone at various heights and discover the rate of filling is not constant. The lesson ends with a discussion of...
CK-12 Foundation
CK-12 Middle School Math Concepts - Grade 6
Twelve chapters cover a multitude of math concepts found in the Common Core standards for sixth grade. Each title provides a brief explanation of what you will find inside the chapter—concepts from which you can click on and learn more...
Todd Bowden
Number Line
Arrange these in order on a number line:
95%
1/3
.700
3/5
5/6
50%
.200
Was that too easy? Don't worry! This app gradually gets more difficult.
Curated OER
Representing Rational Numbers
Seventh graders explore rational numbers. In this fractions, decimals, and percents instructional activity, 7th graders identify and compare equivalencies between fractions, decimals, and percents. Students use hands-on activities to...
Curated OER
Ratio, Proportion And Percent
In this math worksheet, students evaluate and compare the ratios. They also compare the fractions by solving the proportions.
Curated OER
Fractions (Unitary)
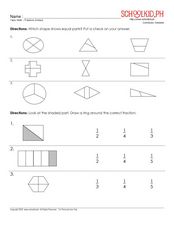
In this fraction worksheet, students determine which shape is divided into equal parts and check their answer. Students then look at shaded parts of a whole and circle the correct fraction. Finally, students determine the fraction for...
Curated OER
Study Buddies - Bar Graphs
In this data collection worksheet, learners work with a partner to make 3 small bar graphs after finding the proper number of circles on the first page. They look at a page of a variety of shapes and separate the circles into black,...


