Curated OER
Aruba Cloud Cover Measured by Satellite
Students analyze cloud cover and to compose written conclusions to a given related scenario. They submit a letter of response and a report detailing their calculations and conclusions.
Curated OER
It's Not Your Fault
Students study the San Andreas Fault, calculate its movements, and compare the movements on both sides. In this earthquake lesson students use the Internet to track movement, and calculate movement using a spreadsheet.
Curated OER
Necessary Nitrogen
Students view a video that presents the biogeochemical cycle of nitrogen. They compare types of soils and consider how different fertilizers affect soil composition.
Curated OER
The Bell Curve
Pupils explore the concept of the bell curve. In this bell curve instructional activity, students discuss the controversy associated with the bell curve. Pupils use an applet to explore a normal distribution. Students discuss mean,...
Curated OER
Technology vs. Nontechnology
Fourth graders determine the range, mean, median and mode using a computer spreadsheet. An identical set of calculations is done without using a computer. The results of each method are compared. They calculate the mode, median and range...
Curated OER
Ecology and the Conservation of Natural Resources
Students examine the components of ecosystems. They compare and contrast an ecosystem to an aquatic ecosystem. They examine a local ecosystem and discuss its components.
Curated OER
Ecology and the Conservation of Natural Resources Lesson 2
Students compare and contrast abiotic and biotic factors. They discuss how these factors effect ecosystems. They answer questions to complete the lesson.
Curated OER
What are the Odds
Students predict the-outcome of an event. In this algebra lesson, students compare and contrast the probability of an event occurring. They calculate the odds of a simple event and make estimation.
Curated OER
Heat Energy- Temperature
Second graders investigate the meaning of temperature. They determine what happens to a thermometer when the temperature rises or falls. They place thermometers in different classroom locations in order to compare the temperature in a...
Curated OER
School Temperatures
Young scholars collect and record temperatures throughout the school. Using this information they compare and contrast the temperatures recorded from various spots throughout the school.
Curated OER
Oil Market Basics
Students explore the global oil market through a web-quest. In this oil market lesson, students conduct a web-quest to gather information related to the global oil market then design and make a mural.
Curated OER
Putting Your Money to Work
Students create a collect data on expenses. In this algebra lesson, students create a spreadsheet to solve scientific equations. They incorporate math, science and technology in this lesson.
Curated OER
The Civil War: Through the Eyes of Hoosier Women-
Fourth graders explain and analyze changes and interactions of Hoosier women in major social and work roles during the Civil War. They recognize and compare the contributions of both women on the home and war fronts.
Curated OER
Pioneers Heading West
Students brainstorm, analyze, compare and contrast,
and illustrate accomplishments of pioneers of the west. Students identify and interpret the Pacific Northwest pioneers. Students present their final projects to the class , including...
Curated OER
Transformations of Energy
Seventh graders investigate the relationship between energy and matter, and measure the mass of various objects. They listen to a teacher-led lecture about potential energy, and in small groups measure the mass of various objects such...
Curated OER
From Restriction Maps to Cladograms
Students develop a matrix to determine the number of differences between each set of primate species. They determine closely related organisms then complete the cladogram and answer a set of questions.
Curated OER
Genetic Traits
Students supplement their study of genetics by collecting and analyzing information about their own and their classmates' characteristics and traits. Students create a database of traits and characteristics to compare and contrast.
Curated OER
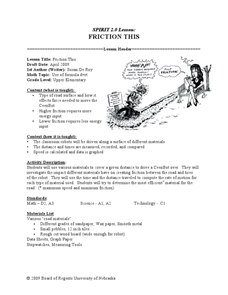
Friction This
Students investigate road surface and calculate speed. In this algebra lesson plan, students analyze the roughness of a road and calculate distance and speed based on friction. They relate friction and energy to speed.
Curated OER
From Arbor Day to Earth Day
Students discuss their answers to a given set of questions regarding Earth Day and Arbor Day. They research using the internet then write a bigraphical sketch of their character.
Pennsylvania Department of Education
Equally Likely and Unequally Likely Outcomes
Students explore probability. In this statistics/probability instructional activity, students compare experimental and theoretical probability and use experimental probability to make predictions and conjectures. Students explore the...
Curated OER
How to Make Histograms
Students collect data and plot it using a histogram. In this statistics lesson plan, students interpret histograms. They find the frequency, percents and density.
Curated OER
The Role of Philanthropy in an Ever Changing World: Where Did it all Start? Time-lines of History
Learners create timeline to trace the history and development of the selected organization, and compare the history of the selected organization to actual historical events.
Curated OER
Breaking Color Barriers
Students compare brown eggs and white eggs. In this color instructional activity, students see two different color eggs and predict what they will look like on the inside. They see that both eggs are the same and compare this to people...
Curated OER
Choose or Lose: The Electoral Process
Students examine the local and national election process. In groups, they brainstorm a list of the issues important to them and compare them to an overall list of issues present in the election. They analyze graphs and complete...


