Fluence Learning
Writing About Informational Text: Political Parties
To demonstrate their ability to craft an analysis of informational text, class members read excerpts from James Madison's "The Federalist No. 10," from George Washington's Farewell Address, and from Thomas Jefferson's First Inaugural...
Curated OER
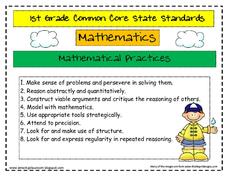
Common Core State Standards 1st Grade Math
Here are the complete set of the math practice standards and the Common Core standards for first grade. They cover operations & algebraic thinking, operations in base 10, measurement and data, and geometry. Illustrated nicely with...
Curated OER
Pick A Short Story
Pupils select a short story and apply various literary elements they have used throughout the year. They deconstruct a short story according to plot, setting, characterization, and theme. Students create a PowerPoint.
University of Georgia
Heating and Cooling of Land Forms
Compare heating and cooling rates of different land forms. A lab activity has groups collect data on the rate of heating and cooling of soil, grass, saltwater, fresh water, and sand. An analysis of the rates shows how the different land...
Curated OER
Real Estate Lesson: Monthly Payments
Students examine real-world data relating to real estate. They conduct Internet research, record data regarding real estate in major cities, graph the data, calculate mortgage payments using a mortgage calculator, and analyze the data.
Curated OER
How Can You Predict the Characteristics of an Unborn Baby?
Students compare three sets of unlabeled human chromosomes and gather related data, trace chromosomes to pair them, and make observations about them.
Curated OER
Evolutionary Relationships Based Upon Comparative Genetics
Students investigate the protein cytochrome c in an attempt to use its genetic chemistry to study possible evolutionary relationships between organisms. The lesson integrates technology with the use computers to perform DNA analysis.
Digital Forsyth
Photo Analysis for Visual Impact
A lesson plan on photo analysis, compare and contrast, and an art project are here for the taking. Fourth graders analyze photographs of gas stations from now and from the past, focusing on how the cars and building designs are a form of...
Curated OER
Math: Methods of Measurement
Fourth graders practice linear measurement skills by applying various measuring instruments to determine the heights of classmates. By measuring the heights of second graders and fourth graders, they construct tables of height and age...
Curated OER
Graph and Compare the Adventure's Temperature Vs. Local Temperature
Students explore the concept graphing data. In this graphing data lesson, students use weather data from their local weather and some other city and graph them. Students plot the local weather vs. another city. Students record...
Buffalo State
Adding and Subtracting Integers Unit
Just because one integer is larger than another doesn't mean it will make sense right away. Go beyond note taking and show learners, through the use of algebra tiles and a Four-Pan Algebra Balance, how the numbers relate to one another...
Kenan Fellows
Lego Thinking and Building
Run a simulated airplane manufacturing plant with your pupils as the builders! Learners build Lego airplane models and collect data on the rate of production, comparing the number produced to the number defective. Using linear...
Illustrative Mathematics
Puzzle Times
Give your mathematicians this set of data and have them create a dot plot, then find mean and median. They are asked to question the values of the mean and median and decide why they are not equal. Have learners write their answers or...
Curated OER
Logistic Growth Model, Explicit Version
Via the concrete setting of estimating the population of the US, your algebra learners are introduced to a logistic growth model. Comparing and contrasting logistic, exponential, linear and quadratic models, to see which fits the data...
Curated OER
Graphing the Forecast - Line Graph or Bar Graph?
Sixth graders compare and contrast bar and line graphs. Using a weather forecast of the area, 6th graders record the high and low temperatures in a table. Students determine and justify the most appropriate graph to display a given set...
Rochester Institue of Technology
Patient Flow
It's time to redesign the healthcare system. The seventh installment of a 9-part technology/engineering series teaches future engineers about patient flow and how to design healthcare centers to improve flow. Classroom simulations allow...
Rochester Institue of Technology
Ergonomic Design
To an engineer, the glass is never half full; it's just double the necessary size. The fifth installment of a nine-part technology and engineering series teaches pupils about the idea of ergonomic design. Measurements of popliteal height...
Mathematics Assessment Project
Modeling Motion: Rolling Cups
Connect the size of a rolling cup to the size of circle it makes. Pupils view videos of cups of different sizes rolling in a circle. Using the videos and additional data, they attempt to determine a relationship between cup measurements...
Nuffield Foundation
Effect of Size on Uptake by Diffusion
Cell size is limited by the surface area to volume ratio, but why is this true? Scholars measure the surface area and volume of cubes before placing them into liquid. After a set amount of time, they measure the uptake by diffusion for...
Serendip
The Molecular Biology of Mutations and Muscular Dystrophy
Different types of mutations cause unique types and degrees of muscular dystrophy. Scholars learn about the types of mutations and the impact on the body. They compare the location of the mutations and draw conclusions about how it is...
University of Wisconsin
Follow the Drop
Young surveyors look for patterns in water flow around campus. Using a map of the school (that you will need to create), they mark the direction of the path of water. They also perform calculations for the volume that becomes runoff. The...
Curated OER
How Many More on a Graph?
First graders examine data on a graph and determine which variable on the graph has more. They draw pictures of their family members and determine which families have more members than other families. Using squares of paper to depict...
Curated OER
Environmental Graphing
Students experiment with graphing. For this graphing introduction lesson, students complete four activities: 1) a bar graph based on class birthdays 2) an estimation graph of the raisins in raisin bread 3) another estimation example with...
Curated OER
Rate of Change
Eleventh graders solve problems dealing with rate of change. In this algebra activity, 11th graders graph their rate of change problems and analyze it comparing their data with each other. They solve problems dealing with percent and...


