Curated OER
Lines of Best Fit
Young scholars determine if there is an associationm in a scatter plot of data. They analyze data through predictios, comparisons, and applications. Students calculate the line of best fit using a graphing calculator. They display data...
Curated OER
Weather or Not
Sixth graders explore weather. For this meteorology lesson, 6th graders create weather instruments and compare and contrast weather data.
Curated OER
Finding Caterpillars
Students examine how animals protect themselves from predators and camouflage themselves. They participate in a simulation in which they locate red and green yarn "caterpillars," organize their data, and generate a bar graph using...
Curated OER
The Modern Atmospheric CO2 Record
Students compare carbon dioxide (CO2) data from the Mauna Loa Observatory , Barrow (Alaska) , and the South Pole over the past 40 years to help them better understand what controls atmospheric (CO2).
Teach Engineering
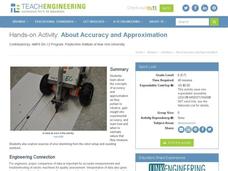
About Accuracy and Approximation
How accurate are robots? Groups draw lines by moving robots backwards and forwards by one rotation of the wheels. Using the appropriate formula, they determine the percent error in the length of the lines in relation to the calculated...
Curated OER
Interpreting Graphs
Sixth graders interpret linear and nonlinear graphs. They create graphs based on a problem set. Next, they represent quantitive relationships on a graph and write a story related to graphing.
Noyce Foundation
Boxes
Teach your class to think outside the box. Scholars use the concept of equality to solve a problem in the assessment task. They determine how to use a scale to identify the one box out of a set of nine boxes that is heavier than the others.
Curated OER
Technology Literacy Challenge Grant Learning Unit
First graders explore counting and classification. They sort leaves, create graphs, write sentences for the data in the graphs, develop graphs for shapes, favorite animals, birthdays, and participate in a die prediction game.
Curated OER
Nanofibers: Why Go Small?
Students explore the surface ratio of an object. In this surface area to volume lesson students construct a data table, make calculations and create a graph.
Kenan Fellows
Reading Airline Maintenance Graphs
Airline mechanics must be precise, or the consequences could be deadly. Their target ranges alter with changes in temperature and pressure. When preparing an airplane for flight, you must read a maintenance graph. The second...
Curated OER
# 14 Experimenting with Copper (II) Solutions
Students determine that the relative concentration of copper ions in water can be determined by a color comparison. They make a copper (II) sulfate solution of a given concentration. Students dilute their initial solutions until their...
Inside Mathematics
Marble Game
Pupils determine the theoretical probability of winning a game of marbles. Individuals compare the theoretical probability to experimental probability for the same game. They continue on to compare two different probability games.
College Board
Using the Java Collections Hierarchy
Collect a set of collections. Professional development material provides teachers with information about collections that are in AP Computer Science. Materials include teaching strategies, sample labs, and worksheets. Educators use the...
Curated OER
Bioterrorism: Development of a "Superbug"
Students compare bacteria and viruses and their roles in biotechnology and bioterrorism. They outline fundamental steps of bacterial transformation and the possible selection processes to identify transformants. They discuss...
NASA
Space-Based Astronomy on the Internet
Young scientists compile everything they have learned into a report in the fifth and final lesson in a unit on the visible light spectrum. Access to photos from observatories, telescopes, and satellites allows learners to compare and...
Ohio Department of Education
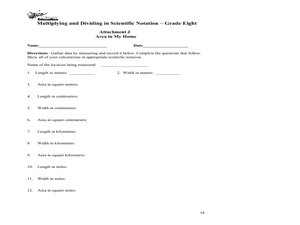
Multiplying and Dividing in Scientific Notation - Grade 8
Here is really nice set of resources on scientific notation. Eighth and ninth graders explore the concept of multiplying and dividing in scientific notation. In this multiplying and dividing numbers in scientific notation instructional...
LABScI
Taxonomy: Who is in My family?
Find similarities in seemingly unlike organisms. The second instructional activity in a series of 12 builds the concept of a taxonomy and explores the use of a dichotomous key. Learners begin in part one by attempting to group a set of...
Fluence Learning
Writing an Opinion Requiring Voting
Challenge writers to compose an essay detailing their stance on, and the history of, voting. Three assignments, each broken down into three parts, requires fifth graders to take notes, read and complete charts, write paragraphs, compare...
Howard County Schools
Planning for Prom
Make the most of your prom—with math! Pupils write and use a quadratic model to determine the optimal price of prom tickets. After determining the costs associated with the event, learners use a graph to analyze the break even point(s).
Curated OER
What's Poppin'?
Second graders determine and compare weights and volumes of popped and unpopped corn to make predictions and solve problems. Students combine the data of each group into a graph. They construct questions, statements and story problems...
Curated OER
Global Warming Part 2: Climate Change
Students examine natural climate fluctuations of the Earth and compare climate change in last 100 years to earlier climate changes. From this data students will begin to define current issues related to global warming.
Curated OER
Exploring Literature and Weather through Chirps
Learners explore and experience information about temperature changes by using crickets' chirps to calculate the temperature. The data is applied to formula and the temperatures are calculated.
Curated OER
The IMF in Action: What Does the IMF Do?
Students use newspapers and the internet to discover what the IMF does. They work together in groups to brainstorm occupations which need another language to be spoken. They also examine data related to trading among countries.
Pennsylvania Department of Education
Alike and Different
Students compare and contrast objects and are introduced to a Venn Diagram. In this alike and different lesson, students make observations regarding properties of objects. Students classify object and build ideas about variables....


