Curated OER
Science Fair With An Energy Efficiency Flair
In order to learn more about energy conservation, pupils work to promote energy efficiency by participating in a school-wide science fair with an emphasis on energy conservation. In addition to displaying their projects, learners invite...
Curated OER
Personal Code of Ethics
Tenth graders develop a personal code of ethics and relate their personal code of ethics to school situations. They discuss steps they will take to resolve ethical issue at school and develop a personal plan to advocate for an ethical...
Curated OER
Does Sunlight Effect Leaf Size?
Learners make estimates and then measure leaves for accuracy. They calculate the area of the leaves by drawing an outline on graph paper and counting the squares. They compare the leaves exposed to sunlight to those that are in constant...
Curated OER
Campaign Signs and Pranksters
Students collect campaign literature and investigate what signs local candidates are using. Students contact local politicians/candidates and interview them about the concepts and creation of their campaign literature. Students compare...
Curated OER
Multimedia Book Report
Young readers plan and draft a book report focusing on the five key components of a novel: plot, character, setting, conflict, and theme. After completing a story board, pupils then prepare a PowerPoint book report that is shown to the...
Curated OER
Adaptation and Diversity on Sheffield Island
Written for an exploration of shoreline ecosystems on Sheffield Island, this gives ecology or marine biology buffs a hands-on experience. Using GPS or visual triangulation techniques, they lay transect lines on a high and a low energy...
Curated OER
Population Ratios
Students access web site and record various population statistics pertaining to a county in the USA of their choice. They use this data to set up and solve ratios. They compare data to make meaning of the numbers.
Curated OER
World Population
Students examine the world population data using MyWorld GIS software and compare and contrast the population characteristics of countries around the world. Students summarize their findings in a report.
Curated OER
Discovering a Law of Space Physics
Students use data collected by an astronomer to determine the relationship between the time it takes the planet to orbit the sun and the average radius of the planet's orbit around the sun. Students use trial and error to find the...
Curated OER
Clouds and Solar Radiation
Students use satellite imaging and Mesonet solar radiation maps to answer questions given to them by the teacher and look for differences and similiarities in the data.
Curated OER
Baseball Statistics
Learners take an in depth examine baseball record breakers. They calculate statistics, not just for one year, but over whole careers, to compare some famous players and find who was the best all-time home run hitter.
Curated OER
Maps
Students investigate threee types of maps. In this algebra lesson, students idenitfy different maps and explore how they relate to the area keeping cllimate and topography in mind. They discuss maps used to navigate land. air and sea.
Curated OER
Math: Graphs and Their Symbols
Second graders examine different types of graphs and discover the meanings of the symbols used on them. After gathering data about themselves, their communities, and the world, they use that information to create graphs. Among the...
Curated OER
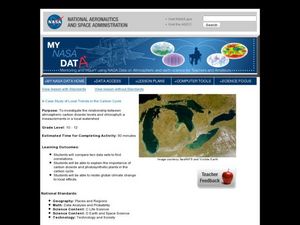
Case Study of Local Trends in the Carbon Cycle
Students examine the relationship between chlorophyll and carbon dioxide in the atmosphere. In this investigative lesson students study the local effects of climate change.
Workforce Solutions
On the Job
Four lessons spotlight a variety of professions while boosting listening and observational skills and making inferences. Lesson one challenges pupils to group cards based on a commonality then justify the relationship they see. Lesson...
Fluence Learning
Writing an Opinion: Buddies that Bark or Purr-fect Pets?
Which animal is best for you—a dog or cat? Why? Engage third graders in an opinion writing assessment that prompts them to read facts about both pets, and then write and decide which pet is best for them.
Curated OER
Chinese Tangrams
Students research the history of Chinese tangrams and complete tangram activities. In this tangram lesson, students complete Internet research to learn the history of Chinese tangrams. Students construct a set of tangrams, compare the...
Curated OER
The Renaissance, Background
Students are introduced to the Renaissance by viewing a PowerPoint presentation. In this Renaissance lesson, students locate the important countries and cities of the Renaissance. Students compare how it was in England from the rest of...
Curated OER
Sunrise/Sunset
Students apply data from a weather-related website to predict patterns in the sunrise and sunset.
Curated OER
Puerto Rico Pyramid Scheme
Students are introduced to the purpose of a population pyramid. In groups, they compare and contrast various population pyramids and identify trends about the civilization being examined. With a focus on Puerto Rico, they work together...
Curated OER
Where Do Green Plants Get Energy?
Fourth graders realize that plants need light, water, and carbon dioxide to carry out photosynthesis. They participate in groups of 4 to plant (with materials provided) a test group of beans to compare to the control group, write a...
Curated OER
Using the Hunter Model and the Holistic Model
Learners increase their knowledge of scientific processes in chemistry. They compare and analyze 3 sets of data, they have gathered, for accuracy and precision.
Curated OER
Sea Floor Spreading II
Students import ocean bathymetry data from text files. They then graph these observations along with model predictions to assess the model's ability to simulate observed topographic features of the North Atlantic. Students use Excel to...
Curated OER
Sea Surface Temperature Trends of the Gulf Stream
Students explore the importance of the Gulf Stream. Using a NASA satellite images, they examine the sea surface temperature. Students collect the temperature at various locations and times. Using spreadsheet technology, they graph the...


