Embedded Math
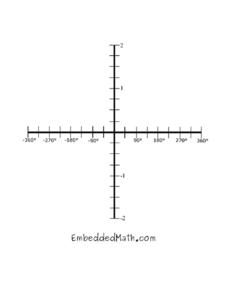
Trig Graph
You and your learners will enjoy having many copies of this trigonometric graph set on the Cartesian coordinate grid with a domain running from -360 degrees to 360 degrees and a range running from -2 to 2.
C-SPAN
2016 Electoral College Map
The electoral college can be confusing for citizens of any age. Clear up misconceptions with a handy printable map that details how many electoral votes are allotted to each state, as well as a history of modern elections, complete with...
Core Knowledge Foundation
Fairy Tales and Tall Tales Tell It Again!™ Read-Aloud Anthology
Enrich a unit on fairy tales and tall tales with a set of read-aloud lessons. Second graders hone writing, vocabulary, comprehension, and literary analysis skills as they read classic stories. Complete with extension projects, discussion...
National Wildlife Federation
Wherefore Art Thou, Albedo?
In the sixth lesson in a series of 21, scholars use NASA data to graph and interpret albedo seasonally and over the course of multiple years. This allows learners to compare albedo trends to changes in sea ice with connections to the...
A&E Television
The World Wars
Contemporaneously known as The Great War, World War I had never seen its match on the global stage—until World War II. An engaging set of resources designed to extend a viewing of the History Channel's The World Wars features discussion...
College Board
2018 AP® Calculus BC Free-Response Questions
Don't just rely on the textbook. Released items from the AP Calculus BC provide pupils and teachers insight on how topics appear on the exam. The six items are divided into calculator and non-calculator sets with half of them also...
Curated OER
Comparing Amounts
In this mathematics worksheet, 1st graders identify who has more money. Then they write how much each person has and circle the one with more money. Students also place a group of coins on their desk and write down how much they have.
Curated OER
Venn Diagram Comparing Settings
In this Venn Diagram worksheet, students complete a Venn Diagram of the towns Sparks and Ember from the book Tennessee Blueprint. Students complete 1 Venn Diagram.
Curated OER
Comparing Fractions Showdown
Students work in groups to compare fractions. They check their answers using fraction manipulatives. They write their answers on a white board.
Curated OER
An Introduction To Sets
Students recognize the symbol for and demonstrate the rules of set.
Curated OER
Comparing Apples and Oranges
Students understand that many organizations in the community have needs. In this philanthropy lesson, students research pros and cons of a philanthropic organization. Students create a multimedia presentation to show why their...
EngageNY
Variability in a Data Distribution
Scholars investigate the spread of associated data sets by comparing the data sets to determine which has a greater variability. Individuals then interpret the mean as the typical value based upon the variability.
Mathematics Vision Project
Module 8: Modeling Data
Statistics come front and center in this unit all about analyzing discrete data. Real-world situations yield data sets that the class then uses to tease out connections and conclusions. Beginning with the basic histogram and...
Curated OER
Applying Ahimsa to Traditional Stories
Investigate the life of Mahatma Gandhi by researching non-violent lifestyles. Learners define the word ahimsa and discuss the personal characteristics that made Gandhi a peaceful warrior. They also create a poster about the story "The...
Virginia Department of Education
Analyzing and Interpreting Statistics
Use measures of variance to compare and analyze data sets. Pupils match histograms of data sets to their respective statistical measures. They then use calculated statistics to further analyze groups of data and use the results to make...
Noyce Foundation
Between the Lines
Explore linear and square dimensions by comparing areas of similar figures. A creative set of five activities designed for elementary through high school classes asks young scholars to compare areas of specific polygons. The first two...
Mathematics Vision Project
Module 4: Linear and Exponential Functions
Sequences and series are traditionally thought of as topics for the pre-calculus or calculus class, when learners are figuring out how to develop limits. But this unit uses patterns and slopes of linear functions in unique ways to bring...
Illustrative Mathematics
Running Around a Track II
On your mark, get set, GO! The class sprints toward the conclusions in a race analysis activity. The staggered start of the 400-m foot race is taken apart in detail, and then learners step back and develop some overall race strategy and...
Illustrative Mathematics
Ordering 4-digit Numbers
Place value is a concept that sets a foundation for mathematical understanding. Ordering these sets of three- and four-digit numbers will help to strengthen that foundation. A great independent practice worksheet or short assessment to...
Mathematics Vision Project
Module 6: Quadratic Functions
Linear, exponential, now it's time for quadratic patterns! Learners build on their skills of modeling patterns by analyzing situations with quadratic functions. The sixth module in the Algebra I series has pupils analyze multiple...
Curated OER
Different Strokes For Different Folktales
Young readers use graphic organizers, such as Venn diagrams and story maps, to analyze a variety of folktales and the elements of a story. They use writing, sequencing activities, and creative art to identify the morals learned from a...
Curated OER
Tall Towers
Linear measurement is the focus of this math lesson. Youngsters work in groups to build towers with blocks. They build towers represented on index cards and determine how many blocks taller one tower is.
Classroom Adventures Program
Creating Characters
Examine character in depth. Over the course of these six lessons, learners explore their own character traits, determine the traits of characters in the books they read, practice comparing and contrasting, and collaborate in small groups...
EngageNY
Solving and Graphing Inequalities Joined by “And” or “Or”
Guide your class through the intricacies of solving compound inequalities with a resource that compares solutions of an equation, less than inequality, and greater than inequality. Once pupils understand the differences, the lesson...
Other popular searches
- Comparing Sets of Objects
- Comparing Sets of Coins
- Venn Diagrams Comparing Sets
- Comparing Sets of Money
- Comparing Sets of Data
- Nouns and Comparing Sets
- Comparing Two Sets of Data


