Curated OER
Fossil Fuels (Part III), The Geology of Coal
Do not overlook this set of lessons just because your school does not have a data analysis system. There is plenty of material here to administer a complete mini unit on the formation, distribution, and properties of coal. Since it...
Curated OER
Photosynthesis
Students recognize the importance of plants as they perform an experiment involving photosynthesis. Students determine the optimum wavelength of light for photosynthesis by exposing plants to different colors of light, collecting data,...
Curated OER
Quadratic Equations with the CBL 2
Learners practice generating parabolas with a motion sensor while determining the vertex form of the equation. They compare it to the regression equation from the calculator onto a data mate software. Each student completes several...
Curated OER
Telephone Time
In this telephone time worksheet, learners study, discuss and compare two sets of data when represented on the same graph. Students set up an original graph.
Curated OER
Box-and-Whisker
Seventh graders are introduced to the concept of box-and-whisker plots. A step-by-step process for creating a box-and-whisker plot is provided. The goal of the instructional activity is that students study the components of a...
Curated OER
Let's Graph It
In this let's graph it worksheet, student interactively answer 10 multiple choice questions about graphing data and types of graphs, then click to check their answers.
Curated OER
M & Ms in a Bag
Students make predictions about the number and colors of M&M's in a snack size package. They create an Excel spreadsheet to record the data from their small group's bag, create a graph of the data, and discuss the variations of data...
Federal Reserve Bank
Cash Flow and Balance Sheets
What is your car worth? How much do you owe? Individuals create their personal cash flow and balance sheets. They learn the difference between an asset and liability using their personal information to complete the activity.
Chicago Botanic Garden
Historical Climate Cycles
Ice core samples give scientists access to climates of old—those from more than 800,000 years ago. Through an analysis of various temperature graphs from ice cores, tree rings, and weather stations, scholars compare historical climates...
Scholastic
Study Jams! Double-Line Graphs
With two summers of babysitting money, Mia needs a way to compare her earning from both years. Show your learners that they can organize the data onto a double-line graph to easily compare which summer was more profitable. The lesson...
Fluence Learning
Writing About Literary Text: Pygmalion and Galatea
Is it crazy to fall in love with your own work, or is that the purest love of all? Compare two renditions of the classic Greek myth Pygmalion and Galatea with a literary analysis exercise. After students compare the similarities and...
Fluence Learning
Writing About Informational Text: Political Parties
To demonstrate their ability to craft an analysis of informational text, class members read excerpts from James Madison's "The Federalist No. 10," from George Washington's Farewell Address, and from Thomas Jefferson's First Inaugural...
CK-12 Foundation
Coefficient of Variation: Diverse Populations
What is the height of school clubs? Learners use sliders to calculate the coefficient of variation for three different school groups. Using the calculations, class members compare the variation in the heights of the groups.
US Department of Commerce
Changes in My State
So much can change in seven years. Young statisticians choose three types of businesses, such as toy stores and amusement parks, and use census data to determine how the number of those businesses in their state changed between 2010 to...
Curated OER
See Turtles Nest! See Turtles Hatch!
Students graph data of sea turtles hatching rates from Watamu/Malindi Marine National Park and Reserve in Kenya. In this math lesson, students use real life science data to calculate mean and median values. Students use the data to...
Curated OER
Technology - Data Collection
Students collect and analyze data from the United States Census Bureau. Using spreadsheet technology, students explore their results and make preductions about income groups. Students compute the mean, median and mode. They create...
Curated OER
Osmosis and the Cell Membrane-part 2
Students participate in a review of diffusion and the basic properties of the cell membrane before exploring the process of osmosis in a lab activity. Using shell-less eggs that have soaked in various solutions, students make...
Curated OER
Velocity
Students explore the concepts of velocity, acceleration, distance and football. They collect data on the velocity of a football and they determine the distance and height of a football when it is thrown. Students compare their findings...
Curated OER
Skittle Graphing (Lesson Plan)
Students discuss the uses of graphs. They use color candies to count and sort before designing graphs. They label the graph papers with appropriate titles and candy colors. They complete the graph bars, and discuss the results with a...
Curated OER
Algebra- Cell Phone Plans
Learners analyze graphs to compare cell phone plans. In this algebra lesson, students work together to analyze phone plans and report the best phone plan. Learners develop tables and graphs.
Curated OER
Smoking: The Real Cost
Third graders discuss the adverse effects of smoking and predict the financial cost of a smoking habit. They collect data regarding the cost of a pack of cigarettes and average packs smoked a day. They create bar graphs displaying the...
Curated OER
Plants and Ecosystems
The relationships within and between ecosystems can be explored. after examining an area for living and non-living things students complete the same examination in the forest ecosystem. Students identify abiotic and biotic elements in an...
Curated OER
Common Core State Standards 1st Grade Math
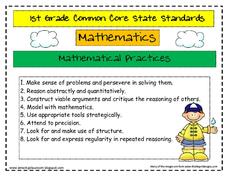
Here are the complete set of the math practice standards and the Common Core standards for first grade. They cover operations & algebraic thinking, operations in base 10, measurement and data, and geometry. Illustrated nicely with...
American Chemical Society
Evaporation
This is one in several lessons that explore the relationship between temperature and phase changes of water. After some discussion, elementary physical scientists place wet paper toweling on a hot and a room-temperature water bag and...


